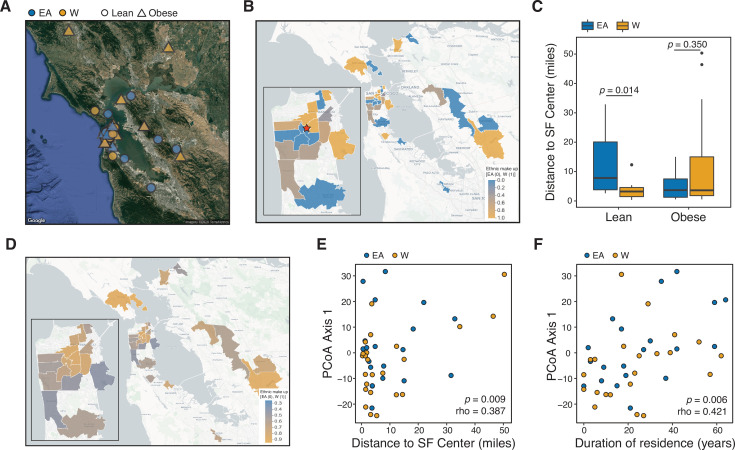
Figure 6. Ethnicity-associated differences in the gut microbiota of lean individuals correlate with geographic location.
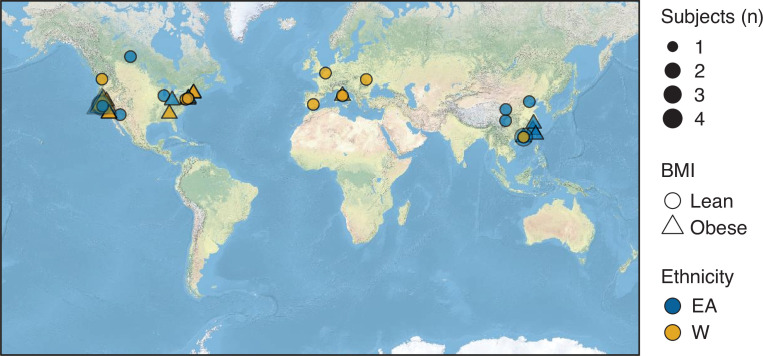
(A) Each symbol represents a subject’s ZIP code. Symbols are colored by ethnicity with shape representing lean and obese subjects (n=44, data was unavailable for two subjects; Supplementary file 1B). (B) A subset of ZIP Code Tabulation Areas (ZCTAs) zoomed in to focus on San Francisco are colored by the proportion of each ethnicity (n=27 ZTCAs). The red star indicates a central point (latitude=37.7585102, longitude=−122.4539916) within San Francisco used for distances calculated in (C). (C) Distance to the center of San Francisco, which is indicated by a star in (B), for IDEO subjects stratified by ethnicity and BMI (n=9–13 individuals/group, p-values indicate Wilcoxon rank-sum test). (D) US census data for EA and W residents in ZCTAs from (B) is displayed by ethnic make-up (a total of 489,117 W and 347,200 EA individuals in these areas). (E, F) PCoA principal coordinate axis 1 from PhILR Euclidean distances of the 16S-seq data is significantly correlated with (E) the distance of subject’s ZIP code to the center of San Francisco and (F) the subject’s duration of residence in the SF Bay Area (n=44 subjects; Spearman rank correlation). Data in (E) and (F) reflects 16S-seq.
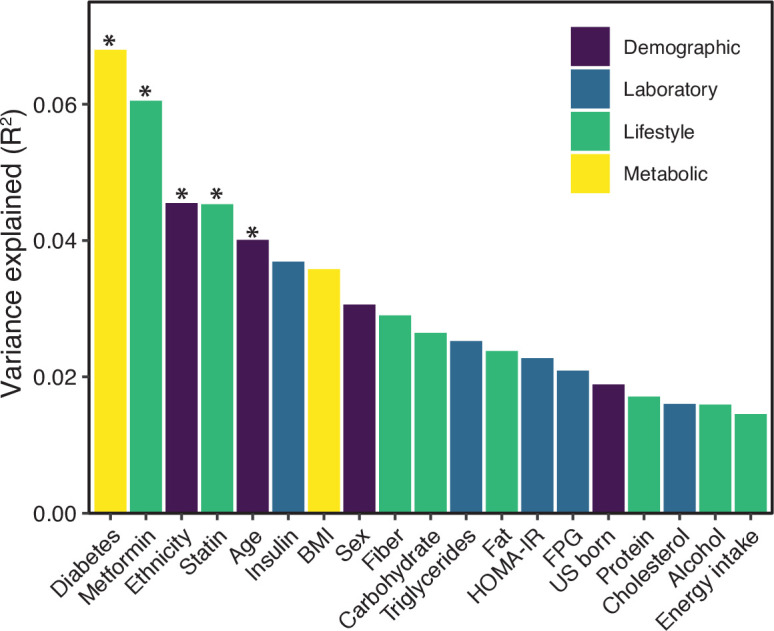
Figure 6—figure supplement 1. Variables associated with variance in microbial 16S-seq data.


