. 2021 Oct 29;10:e72841. doi: 10.7554/eLife.72841

Figure 4. Tomosyn inhibits release independent of Synaptotagmin 1 and 7.

(A) Average evoked response in 2.0 mM Ca2+ for control and tomosynNA1 (left) compared to representative traces of syt1 nulls (Syt1N13/AD4) and tomosyn/syt1 double mutants (TomNA1;Syt1N13/AD4, right). (B) Quantification of average evoked response area (nA*msec) per NMJ in 2.0 mM Ca2+ (syt1N13/AD4: 37.22, 37.13 ± 5.139, n = 12; tomosynNA1/syt1N13/AD4: 66.59, 69.05 ± 4.471, n = 10; p = 0.0002; ≥ 5 larvae per group). (C) Average EJC response in 2.0 mM Ca2+. (D) Log normalized average evoked response in 2.0 mM Ca2+. (E) Normalized cumulative charge transfer for the average evoked response in 2.0 mM Ca2+. (F) The slow component of evoked release was identified by fitting a double logarithmic function to the average normalized cumulative charge transfer per NMJ in 2.0 mM Ca2+ and plotted as a percent of total charge transfer (syt1N13/AD4: 43.69, 44.55 ± 3.717, n = 11; tomosynNA1/syt1N13/AD4: 75.38, 76.72 ± 2.295, n = 10; p < 0.0001; ≥ 5 larvae per group). (G) Representative mEJC traces. (H) Quantification of mEJC rate (Hz) per NMJ (syt1N13/AD4: 5.567, 6.192 ± 0.7904, n = 12; tomosynNA1, syt1N13/AD4: 17.17, 17.17 ± 1.034, n = 10; p < 0.0001; ≥ 5 larvae per group). (I) Average evoked response in 0.3 mM Ca2+ of control (Syt7M1 control), syt7 null (Syt7M1), tomosyn null (tomosynNA1), and tomosyn/syt7 double null (tomosynNA1;;;Syt7M1). (J) Quantification of average evoked response area (nA*msec) per NMJ in 0.3 mM Ca2+ (control: 437.4, 437.4 ± 36.11, n = 8; syt7M1: 844.6, 840.4 ± 33.77, n = 9; tomosynNA1: 1602, 1627 ± 94.19, n = 8; tomosynNA1, syt7M1: 1920, 1923 ± 108.4, n = 8; p < 0.0001; ≥ 5 larvae per group). (K) Representative mEJC traces. (L) Quantification of mEJC rate per NMJ (Hz) (control: 1.056, 1.070 ± 0.1290, n = 8; syt7M1: 1.617, 1.569 ± 0.161, n = 8; tomosynNA1: 6.256, 6.404 ± 0.7475, n = 8; tomosynNA1, syt7M1: 5.092, 5.304 ± 0.3292, n = 8; p < 0.0001; ≥ 5 larvae per group). Complete data for this figure provided in Figure 4—source data 1.

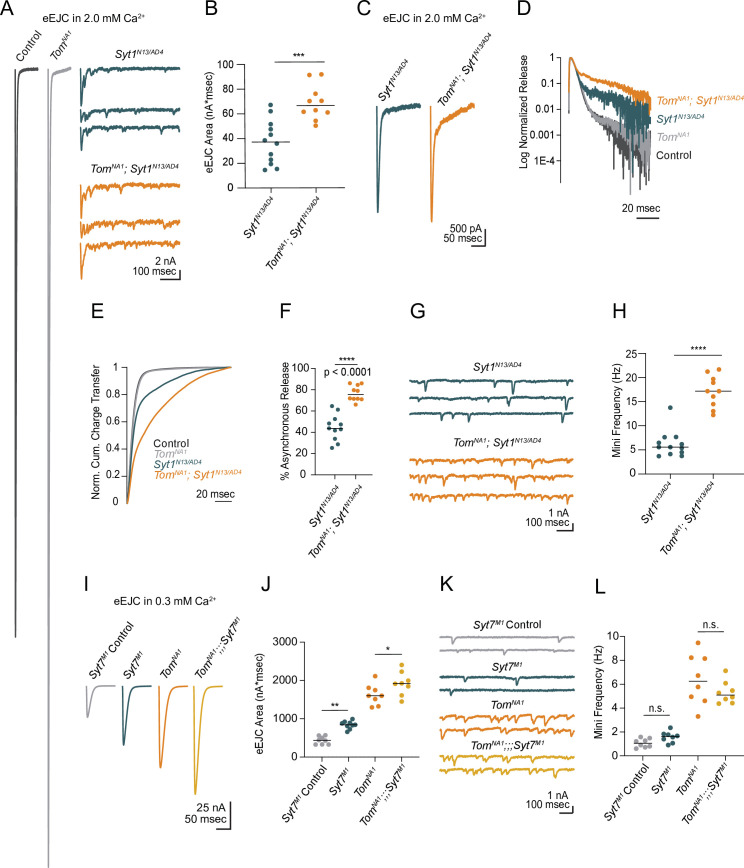
Figure 4—source data 1. Source data for Figure 4.

Figure 4.

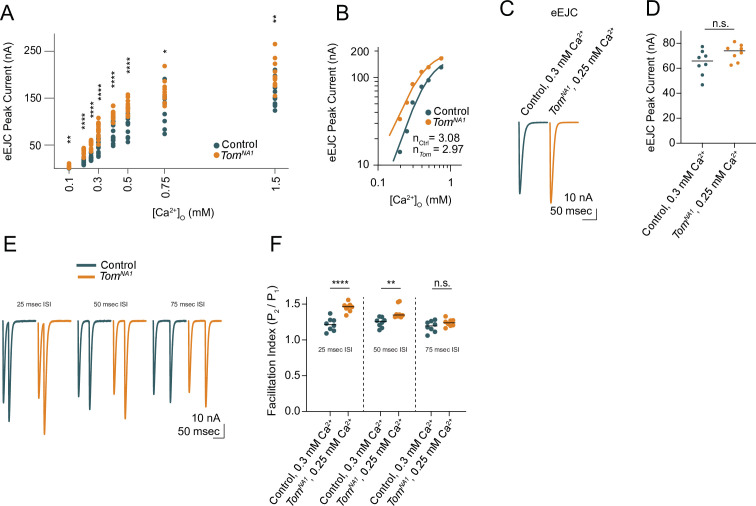
Figure 4—figure supplement 1. Tomosyn inhibits release in a Ca2+-independent mechanism.

Figure 4—figure supplement 1.

(A) Quantification of average EJC peak amplitude (nA) per NMJ across a range of Ca2+ concentrations, including 0.1 mM (control: 0.7351, 0.8639 ± 0.1197, n = 12; tomosynNA1: 2.846, 3.779 ± 0.7682, n = 12; p = 0.0011; ≥ 7 larvae per group), 0.2 mM (control: 13.29, 14.14 ± 1.591, n = 12; tomosynNA1: 35.03, 33.49 ± 2.207, n = 13; p < 0.0001; ≥ 8 larvae per group), 0.25 mM (control: 22.87, 24.31 ± 1.876, n = 12; tomosynNA1: 54.26, 51.66 ± 2.273, n = 12; p < 0.0001; ≥ 7 larvae per group), 0.3 mM (control: 55.30, 51.78 ± 3.522, n = 17; tomosynNA1: 83.74, 83.74 ± 3.378, n = 128 p < 0.0001; ≥ 10 larvae per group), 0.4 mM (control: 73.90, 78.32 ± 5.599, n = 14; tomosynNA1: 114.7, 115.5 ± 3.090, n = 12; p < 0.0001; ≥ 10 larvae per group), 0.5 mM (control: 97.09, 92.87 ± 6.413, n = 12; tomosynNA1: 128.6, 130.7 ± 4.415, n = 12; p < 0.0001; ≥ 10 larvae per group), 0.75 mM (control: 139.3, 130.2 ± 11.49, n = 10; tomosynNA1: 159.8, 164.7 ± 7.758, n = 10; p = 0.0229; ≥ 7 larvae per group), and 1.5 mM (control: 150.5, 159.8 ± 8.010, n = 12; tomosynNA1: 191.2, 198.1 ± 8.781, n = 12; p = 0.0039; ≥ 7 larvae per group). (B) Log-log plot of evoked response peak amplitude across the Ca2+ range, fit with a four-parameter logistic regression. The Hill slope is not significantly different between groups (control: 3.08 ± 0.48; tomosynNA1: 2.97 ± 0.28; extra sum-of-squares F test, p = 0.8272). (C) Average evoked response in Ca2+ concentrations where first evoked response amplitude is similar between control and tomosynNA1 (0.3 mM for control, 0.25 mM for tomosynNA1). (D) Quantification of average EJC amplitude (nA) per NMJ (control, 0.3 mM Ca2+: 65.81, 64.44 ± 3.566, n = 8; tomosynNA1, 0.25 mM Ca2+: 74.02, 72.58 ± 2.346, n = 8; p = 0.0773; ≥ 7 larvae per group). (E) Representative paired-pulse recordings with interstimulus intervals (ISI) of 25 msec, 50 msec, and 75 ms. (F) Quantification of average facilitation index per NMJ, calculated as the fold change in evoked peak current amplitude between pulse 1 and pulse 2. Three different ISIs were tested, including 25 ms (control, 0.3 mM Ca2+: 1.214, 1.216 ± 0.03225, n = 8; tomosynNA1, 0.25 mM Ca2+: 1.463, 1.455 ± 0.02237, n = 8; p < 0.0001; ≥ 7 larvae per group), 50 ms (control, 0.3 mM Ca2+: 1.256, 1.244 ± 0.02428, n = 8; tomosynNA1, 0.25 mM Ca2+: 1.349, 1.386 ± 0.03265, n = 8; p = 0.0035; ≥ 7 larvae per group) and 75 msec (control, 0.3 mM Ca2+: 1.197, 1.189 ± 0.02715, n = 8; tomosynNA1, 0.25 mM Ca2+: 1.239, 1.240 ± 0.01851, n = 8; p = 0.1396; ≥ 7 larvae per group). Complete data provided in Figure 4—figure supplement 1—source data 1.
Figure 4—figure supplement 1—source data 1. Source data for Figure 4—figure supplement 1.