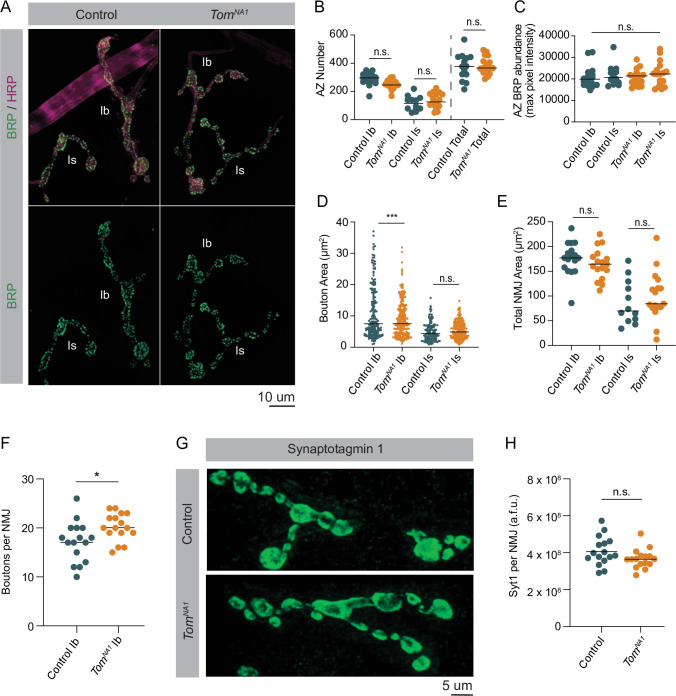
Figure 5. Loss of Tomosyn does not affect AZ number, NMJ area or SV abundance.
(A) Representative confocal images of immunohistochemistry against BRP (nc82) and neuronal membranes (anti-HRP). (B) Quantification of AZ number per muscle 4 NMJ for Ib, Is and both (control, Ib: 296.0, 288.2 ± 10.71, n = 17; control, Is: 115.5, 115.8 ± 14.97, n = 12; tomosynNA1, Ib: 246.0, 249.7 ± 7.824, n = 17; tomosynNA1, Is: 126.0, 134.1 ± 12.52, n = 17; control, total: 378.0, 374.8 ± 25.07, n = 14; tomosynNA1, total: 366.0, 383.9 ± 14.74, n = 17; p = 0.0001; ≥ 7 larvae per group). (C) Quantification of average BRP abundance per AZ per muscle 4 NMJ, measured as average of maximum pixel intensity of each BRP puncta in arbitrary fluorescence intensity units (control, Ib: 19911, 20722 ± 1210,, n = 17; control, Is: 20682, 21733 ± 1448,, n = 12; tomosynNA1, Ib: 21430, 20681 ± 895.7, n = 17; tomosynNA1, Is: 22275, 22172 ± 1372,, n = 17; p = 0.7654; ≥ 7 larvae per group). (D) Quantification of average bouton size (um2) per muscle 4 NMJ measured as the HRP positive area for each bouton along the arbor (control, Ib: 7.489, 12.16 ± 1.013, n = 195; control, Is: 4.342, 4.974 ± 0.2488, n = 140; tomosynNA1, Ib: 7.508, 8.953 ± 0.3671, n = 241; tomosynNA1, Is: 4.873, 5.413 ± 0.1777, n = 229; p = 0.7654; ≥ 7 larvae per group). (E) Quantification of muscle 4 NMJ area (um2) measured as HRP positive area (control, Ib: 176.9, 176.0 ± 8.056, n = 17; control, Is: 69.76, 88.9 ± 12.89, n = 12; tomosynNA1, Ib: 164.5, 164.7 ± 7.527, n = 17; tomosynNA1, Is: 84.32, 99.69 ± 11.80, n = 17; p < 0.0001; ≥ 7 larvae per group). (F) Quantification of muscle four bouton number per Ib motoneuron (control: 17.50, 17.19 ± 1.030, n = 16; tomosynNA1: 20, 20.19 ± 0.7025, n = 16; p = 0.0225 ≥ 7 larvae per group). (G) Representative NMJs stained with Syt1 antisera. (H) Quantification of Syt1 expression (sum of arbitrary fluorescence units) per Ib motoneuron (control: 3.913*10^8, 4.083*10^8 ± 0.949* 10^8, n = 16; tomosynNA1: 3.3900* 10^8, 3.6713*10^8 ± 0.1297*10^8, n = 16; p = 0.0892 ≥ 7 larvae per group). Complete data found in Figure 5—source data 1.

