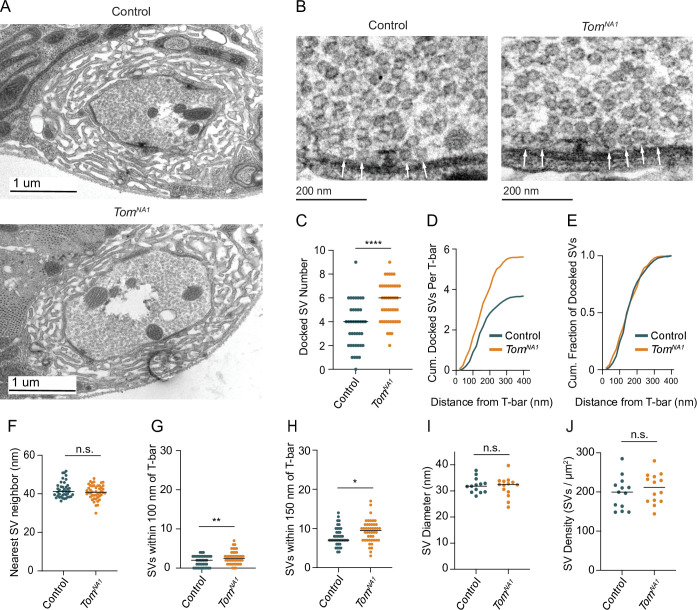
Figure 6. Tomosyn negatively regulates SV docking.
(A) Representative TEM bouton cross-sections at Ib NMJs. (B) Representative micrographs of Ib AZs. Arrows indicate docked SVs. (C) Quantification of docked SV number along each AZ electron density (control: 4, 3.7 ± 0.3, n = 40 AZs; tomosynNA1: 6, 5.609 ± 0.2437, n = 48 AZs; p < 0.0001; three larvae per group). (D) Average cumulative number of docked SVs at each distance from the T-bar center. (E) Docked SV distance from the AZ center, plotted as cumulative fraction of docked SVs at each distance from T-bar. (F) Quantification per micrograph of average distance (nm) from each SV to its nearest neighbor (control: 41.16, 42.02 ± 0.6476, n = 40 micrographs; tomosynNA1: 40.78 nm, 40.91 ± 0.5561, n = 46 micrographs; p = 0.1931; three larvae per group). (G) Quantification of SV number closer than 100 nm to the T-bar (control: 1, 1.075 ± 0.1535, n = 40 AZs; tomosynNA1: 2, 1.739 ± 0.1927, n = 46 AZs; p = 0.0099; three larvae per group). (H) Quantification of SV number closer than 150 nm to the T-bar (control: 7, 7.950 ± 0.3772, n = 40 AZs; tomosynNA1: 9.5, 9.261 ± 0.4164, n = 46 AZs; p = 0.0236; three larvae per group). (I) Quantification of average SV diameter (nm) per micrograph (control: 31.81, 32.11 ± 0.7935, n = 13 boutons; tomosynNA1: 32.40, 31.59 ± 1.050, n = 14 boutons; p = 0.7005; three larvae per group). (J) Quantification of average SV density per bouton area (SVs/um2) per micrograph (control: 199.6, 197.9 ± 11.52, n = 13 boutons; tomosynNA1: 211.8, 209.2 ± 10.24, n = 14 boutons; p = 0.4690; three larvae per group). Complete data found in Figure 6—source data 1.

