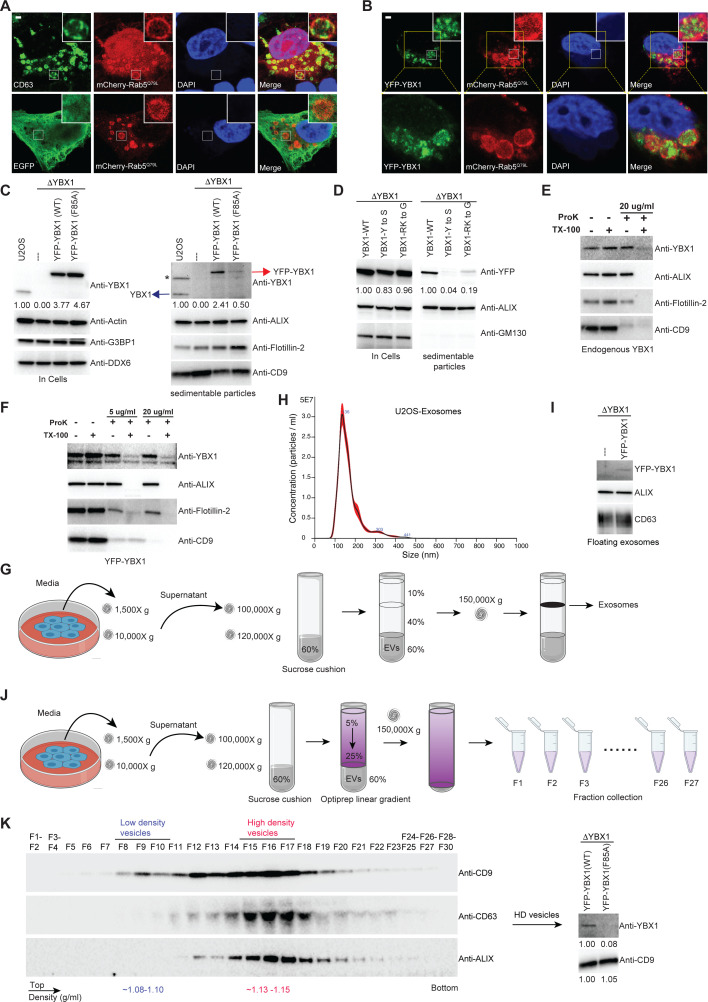
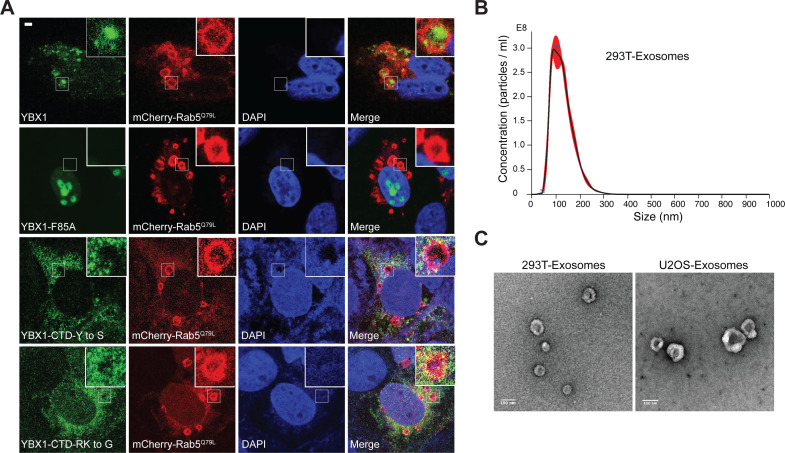
Figure 4. IDR-driven YBX1 phase separation is required for sorting YBX1 into exosomes.
(A) Representative microscope images from U2OS cells expressing mChery-RAB5Q79L. Confocal micrographs of cells expressing mCherry-RAB5Q79L, alone (upper row) or with EGFP (lower row). Cells are stained with anti-CD63 (upper row) or with anti-GFP (lower row). (B) Confocal micrographs of U2OS cells expressing mChery-RAB5Q79L and YFP-YBX1. (C) Over-expression of YBX1 in U2OS cells increased the secretion of YBX1 in EVs. Immunoblots for the indicated protein markers in cells and high-speed pellet fractions. The numbers under the YBX1 blot represent quantification analysis of endogenous YBX1, YFP-YBX1, and YFP-YBX1-F85A in cells and sedimentable particles by Fiji software. ‘*’ is a non-specific band; Blue arrow represents endogenous YBX1; Red arrow represents fusion YBX1 or YBX1-F85A. (D) IDR-driven YBX1 phase separation is required for YBX1 secretion in EVs. Immunoblots for the indicated protein markers in U2OS cells and high-speed pellet fractions. The numbers under the YFP blot represent quantification analysis of endogenous YBX1 and variants in cells and sedimentable particles by Fiji software. (E) Proteinase K protection assay on high-speed pellet fractions from U2OS cells. Triton X-100 (0.5%) was used to disrupt the membranes. Immunoblots for YBX1, ALIX, Flotillin-2, and CD9 are shown. (F) Proteinase K protection assay on high-speed pellet fractions from U2OS cells expressing YFP-YBX1. Triton X-100 (0.5%) was used to disrupt the membranes. Immunoblots for YBX1, ALIX, Flotillin-2, and CD9 are shown. (G) Schematic showing exosome purification with buoyant density flotation in a sucrose step gradient. (H) Nanoparticle tracking analysis (NTA) quantification of exosomes from cultured U2OS cells. (I) YFP-YBX1 detected in sucrose post-flotation fraction from U2OS cells. Immunoblots for YBX1, ALIX, and CD63 from buoyant exosomes are shown. (J) Schematic showing exosome purification with buoyant density flotation in a linear iodixanol gradient. (K) Immunoblots across the iodixanol gradient from U2OS cells for classical exosome markers CD9, CD63 and ALIX (the left panel). Collection of fractions F15-F17 corresponding to high density vesicles and immunoblots for YBX1 and CD9. The numbers under YBX1 blot and CD9 blot represent quantification analysis of YFP-YBX1-WT or YFP-YBX1-F85A and CD9 in HD vesicles, respectively, by Fiji software. Scale bars, 3 µm.


