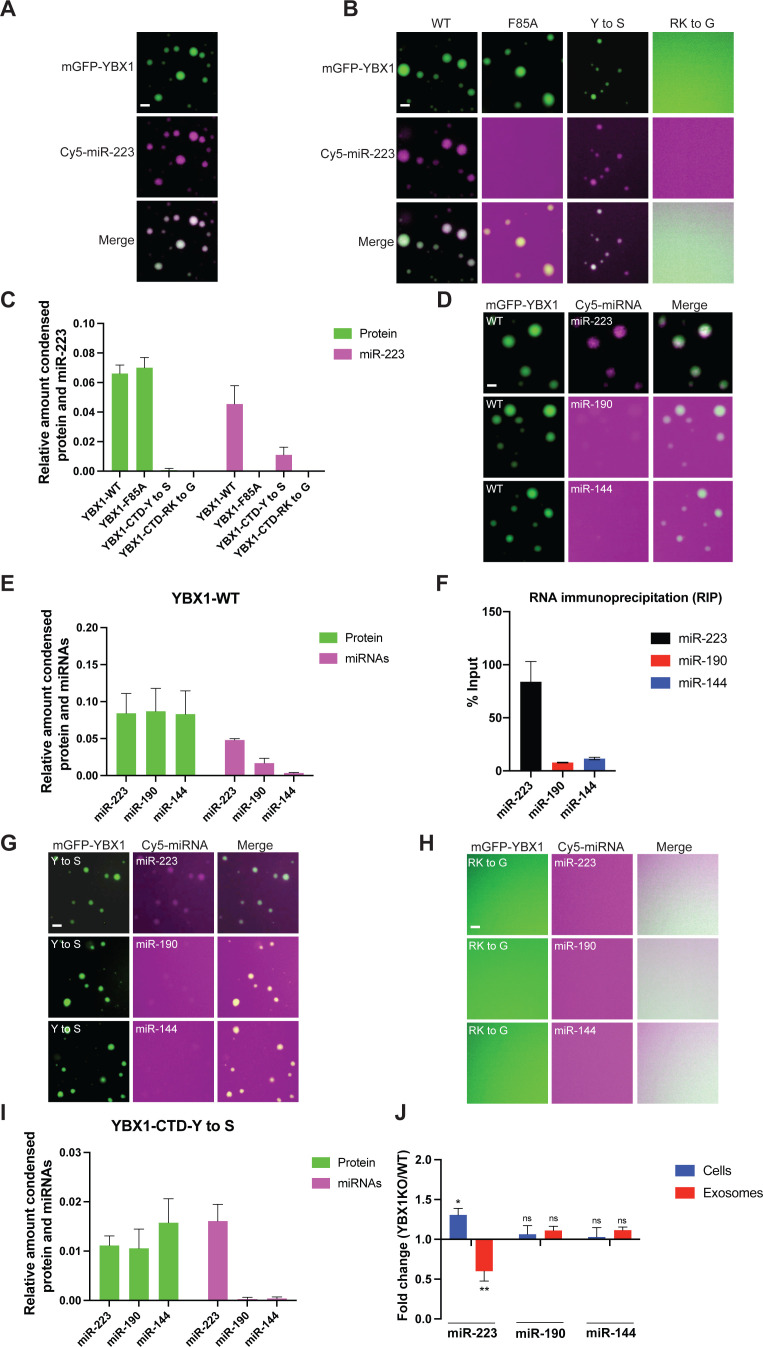
Figure 6. YBX1 phase-separated droplets recruit miRNAs with selectivity correlated with the exosome sorting ability in vivo.
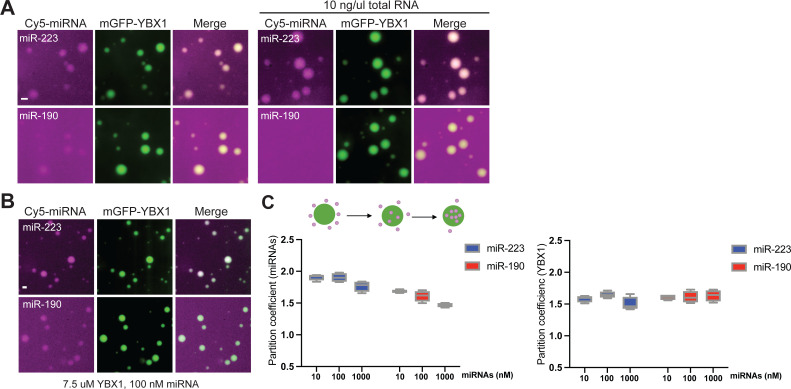
(A) YBX1 phase-separated droplets recruit miR-223. Purified mGFP-YBX1 was incubated with Cy5 labeled miR-223 together with 10 ng/µl total RNA in LLPS buffer and then observed under a microscope. (B, C) The recruitment of miR-223 into YBX1 phase-separated droplets depends on the ability of YBX1 to bind RNA rather than phase separation. Representative images (400 × 400 pixels) (B) and quantification (C) of condensed miR-223 and YBX1 protein. Relative amount condensed protein or miRNAs was calculated as ratio of total intensity of protein inside droplets to total intensity of protein both inside and outside of droplets as quantified using Fiji software. Three images (2048 x 2048 pixels) for per condition were analyzed. The results are plotted as the mean ± the standard deviation (SD). (D, E) YBX1 liquid droplets recruit miRNAs in a selective manner. Purified mGFP-YBX1 was incubated with Cy5 labeled miR-223, miR-190, or miR-144 individually, together with 10 ng/µl total cellular RNA in LLPS buffer and then observed under a microscope. Representative images (400 × 400 pixels) (D) and quantification (E) of condensed miRNAs and YBX1 protein. Relative amounts of condensed protein and RNA were calculated as described in (C). Three images (2048 x 2048 pixels) per condition were analyzed. The results are plotted as the mean ± the standard deviation (SD). (F) RIP assay with GFP-trap beads on YFP-YBX1 expressing HEK293T cell extracts. miRNAs in immunoprecipitated samples were determined by RT-qPCR using Taqman miRNAs assay, and reported as percentage of input sample (% input). Data are plotted as means ± SD of three independent experiments. (G) YBX1-CTD-Y to S mutant recruits miRNAs inefficiently but selectively. Purified mGFP-YBX1-CTD-Y to S was incubated with Cy5 labeled miR-223, miR-190 or miR-144 independently, together with 10 ng/µl total cellular RNA in LLPS buffer and then observed under a microscope. (H) YBX1-CTD-RK to G mutant failed to phase separate and recruit miRNAs. Purified mGFP-YBX1-CTD-RK to G was incubated with Cy5 labeled miR-223, miR-190 or miR-144 independently, together with 10 ng/µl total cellular RNA in LLPS buffer and then observed under a microscope. (I) Quantification of condensed miRNAs and YBX1 protein from (G). Relative amount of condensed protein and RNA were calculated as described in (C). Three images (2048 x 2048 pixels) per condition were analyzed. The results are plotted as the mean ± the standard deviation (SD). (J) YBX1 is required for sorting miR-223 but not miR-190 and miR-144 into exosomes. Exosomes were purified as in Figure 4G. Fold change of miR-223, miR-190, and miR-144 in cells and purified exosomes from indicated cells quantified by RT-qPCR. All quantifications represent means from three independent experiments and error bars represent standard derivations. Statistical significance was performed using unpaired t-test (*p < 0.05, **p < 0.01, and ns = not significant). Scale bars, 3 µm.


