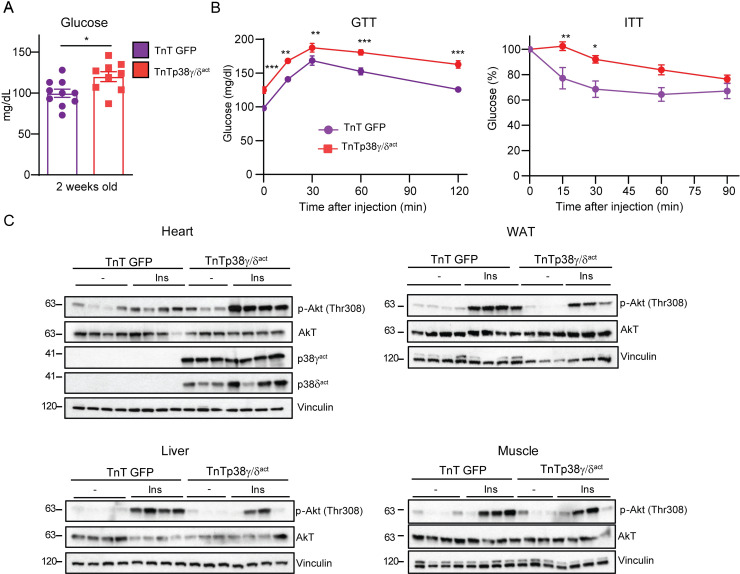
Fig 4. Cardiac-specific p38γ/δact overexpression leads to glucose intolerance and insulin resistance.
Mice were treated as for Fig 3. (A) Blood glucose levels. (B) GTT and ITT. (C) Immunoblot analysis of insulin-stimulated Akt phosphorylation (at Thr308) in heart, WAT, liver, and skeletal muscle. Mice at PD14 were killed 15 min after IP insulin injection. Data are mean ± SEM (n = 7–10). *p < 0.05; **p < 0.01; ***p < 0.001 by Student t test or two-way ANOVA coupled to Tukey posttest. Raw data are given in S14 Fig. GTT, glucose tolerance test; ITT, insulin tolerance test; WAT, white adipose tissue.

