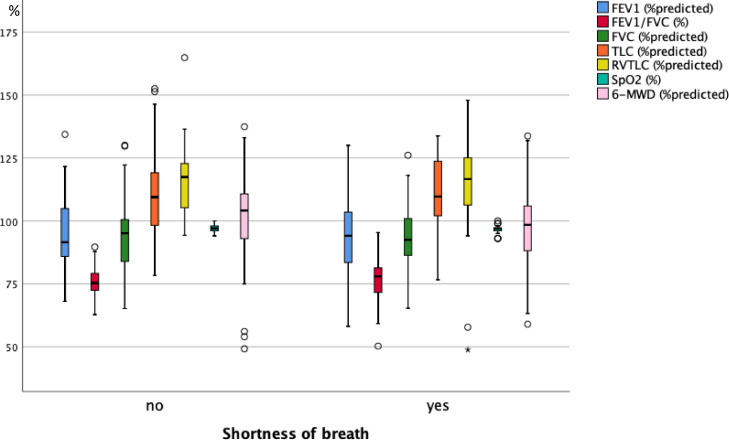
Fig. 3A.
Box plots of functional measures in percent predicted, or percentages for SpO2 and FEV1/FVC, for the two groups of patients either reporting or not reporting shortness of breath at the follow-up visit. SpO2 = oxygen saturation from pulse oximetry, FEV1 = forced expiratory volume in 1 s, FVC = forced vital capacity, TLC = total lung capacity, RV = residual capacity, 6-MWD = 6 min walk distance. The boxes indicate the quartiles, the horizontal bar the median value, the whiskers the 10- and 90-percentiles, and the circles points outside of these. In none of the measures there were statistically significant differences between the two groups (Mann-Whitney U-test).

