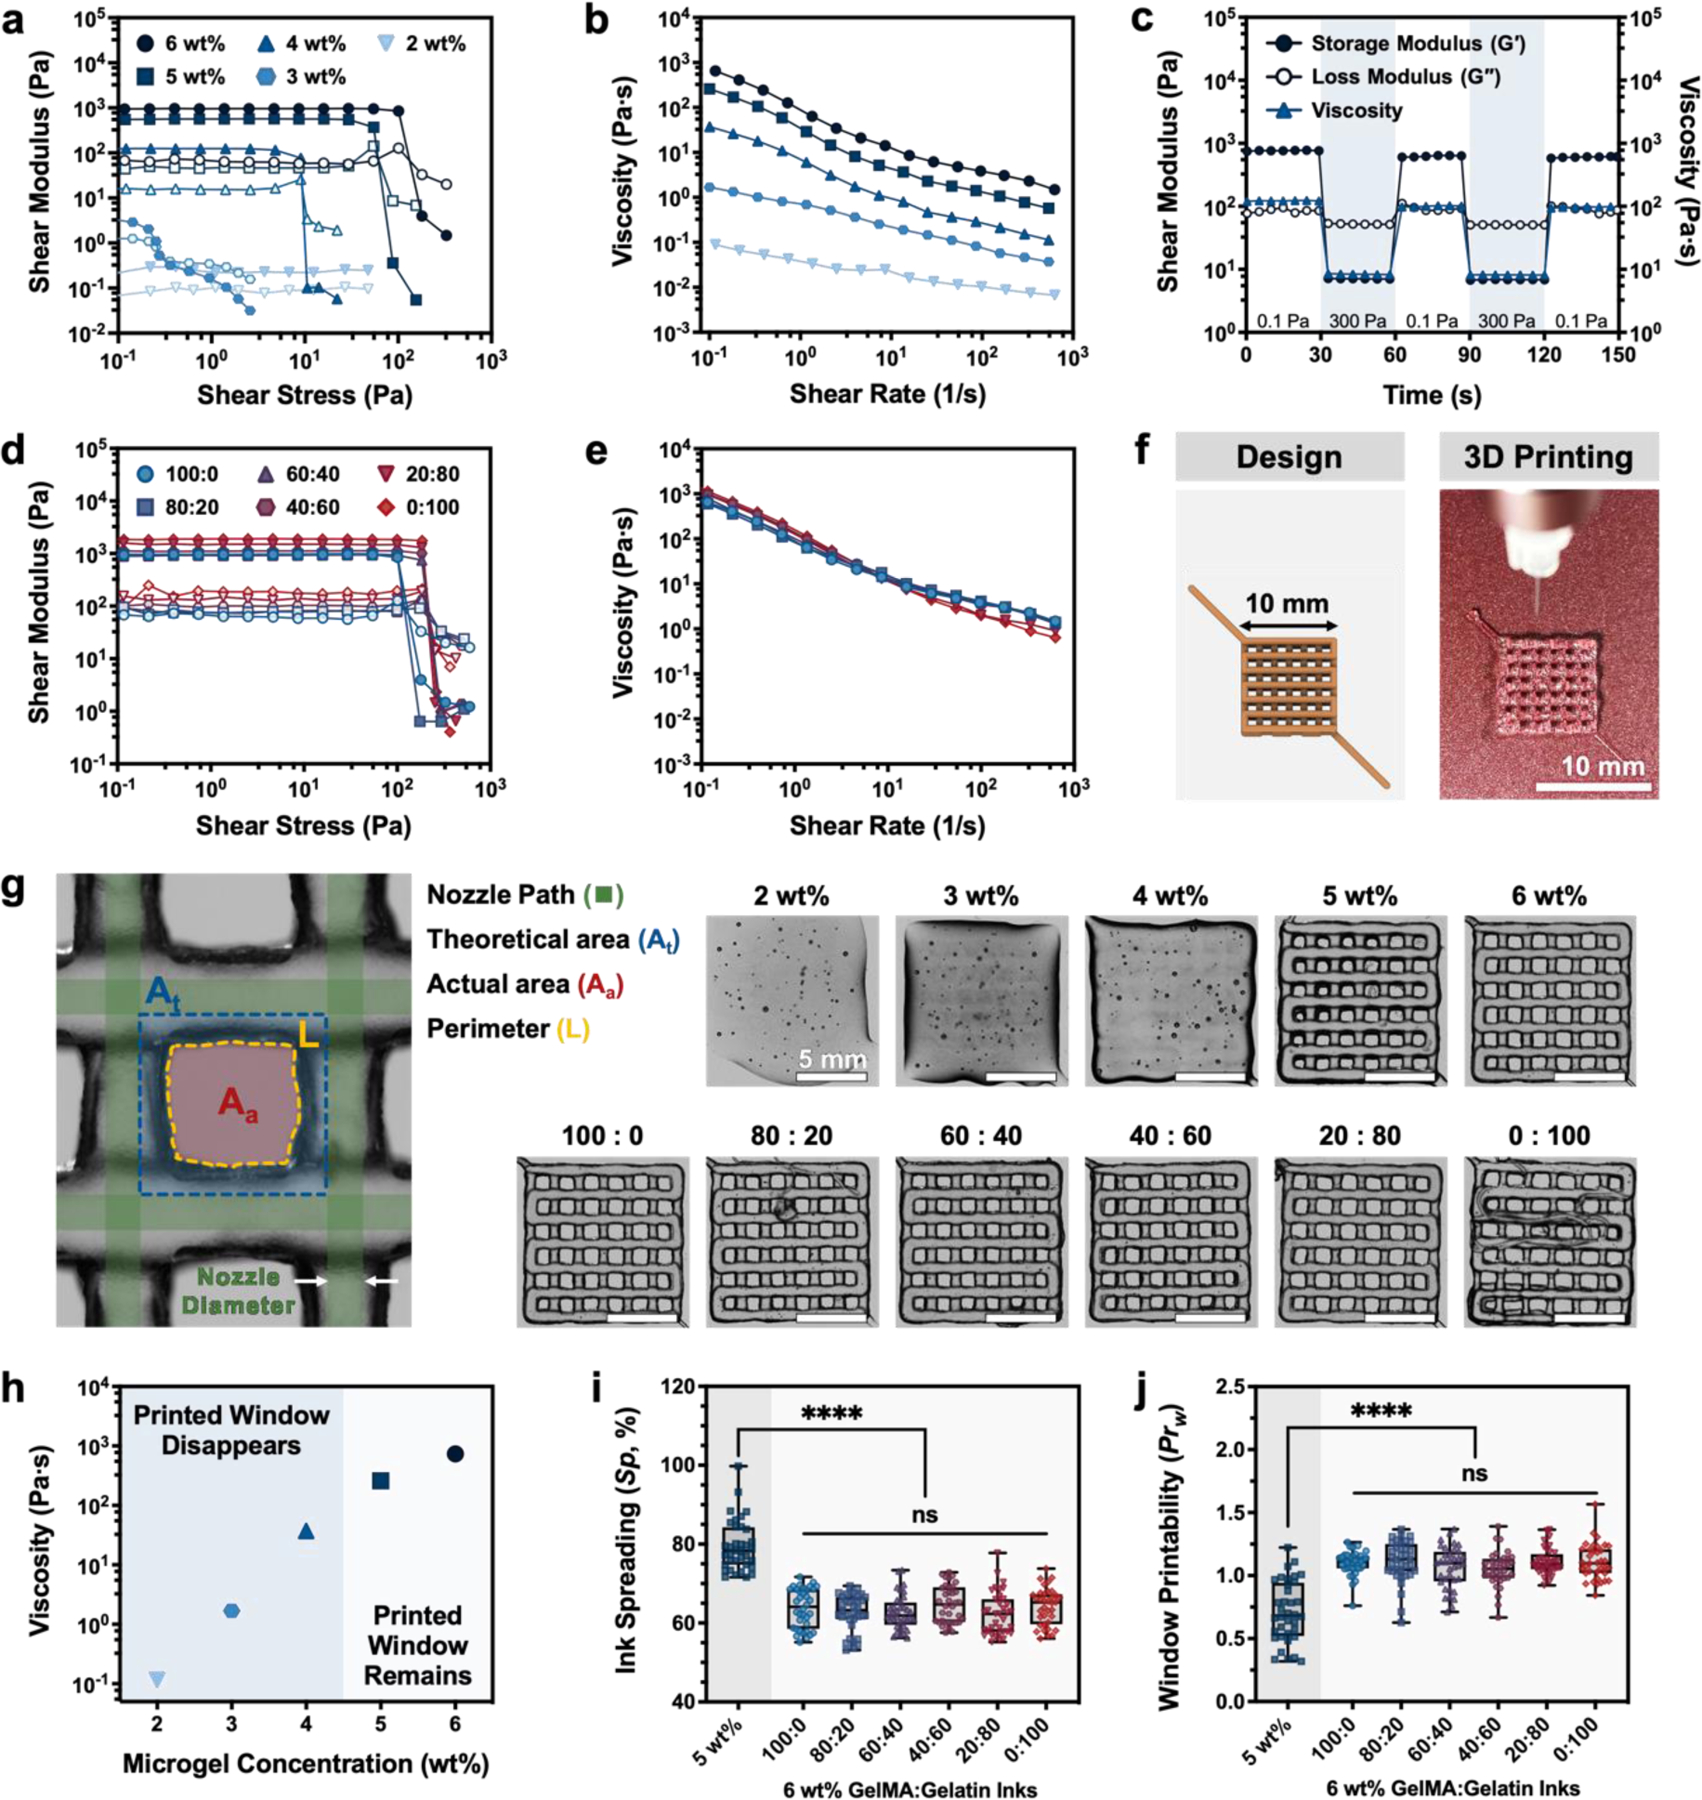
Figure 2.

Rheological characteristics and printability of GelMA and gelatin microgel inks without UV crosslinking. (a) Storage moduli (G′, filled symbols) and loss moduli (G″, open symbols) of GelMA microgel inks with a range of total microgel concentration (2–6 wt%) as a function of shear stress (0.1–1000 Pa). (b) Shear viscosity with increasing shear rates (0.1–1000 s−1) demonstrates that GelMA microgel inks are shear-thinning. (c) Evaluation of the self-recovery of a 6-wt% GelMA microgel ink under alternating shear stress (0.1 Pa and 300 Pa). (d) Storage moduli (G′, filled symbols) and loss moduli (G″, open symbols) of composite GelMA:gelatin microgel inks with different ratios (all GelMA: 100:0; all gelatin: 0:100) as a function of shear stress (0.1–1000 Pa). (e) Shear viscosity with increasing shear rates (0.1–1000 s−1) of sacrificial gelatin microgel-laden composite inks. (f) 3D model and representative image of an uncrosslinked lattice structure 3D printed in air using a 6-wt% microgel ink. (g) Optical microscopic images of 3D printed lattice structures made using GelMA with different concentration from 2 to 6 wt% (top row) and 6 wt% GelMA:gelatin microgel composite inks (bottom row) with different ratios from 0:100 to 100:0. (h) Apparent viscosity of GelMA microgel inks at an applied shear rate of 0.1 s−1 as a function of GelMA microgel concentration, with printable (“Printed Window Remains”) and not printable (“Printed Window Disappears”) inks labeled based on printing studies shown in (g,i, and j). (i) The quantified ink spreading (Sp) and (j) window printability (Prw) of 6-wt% inks with different GelMA:gelatin microgel ratios compared to a 5-wt% microgel ink. Data in (i) and (j) plotted as a box and whisker plot, with whiskers showing the minimum and maximum values, and a superimposed scatter plot of all points; n = 36 windows. Scale bars are 10 mm in panel f and 5 mm in panel g. Statistical significance tested by one-way ANOVA with Tukey’s post-hoc analysis; n.s. = not significant (p > 0.05), *p < 0.05, **p < 0.01, ***p < 0.001, ****p < 0.0001.
