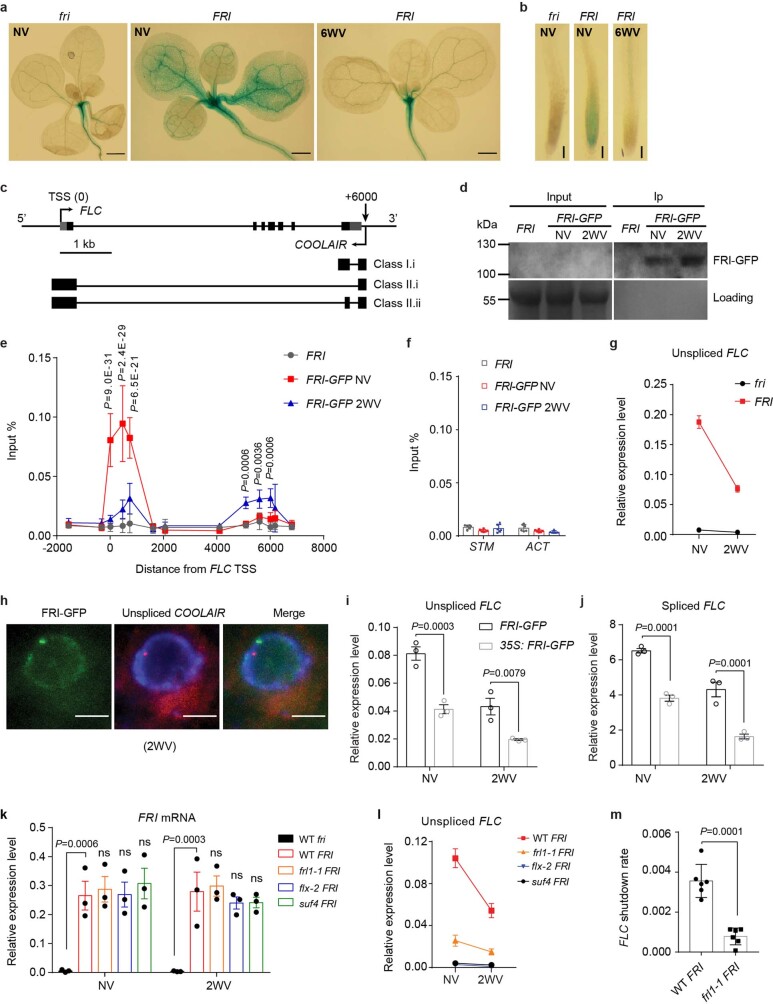
Extended Data Fig. 7. FRI occupancy on the FLC promoter is reduced in the cold and correlates with FLC transcriptional shutdown.
a, b, Spatial expression patterns of a translational FLC-GUS reporter in aerial parts (a) and root tips (b) of NV and 6WV plants in fri and FRI backgrounds. Scale bars, 1 mm (a) and 100 μm (b). Data represents two independent experiments. c, Schematic illustration of FLC and COOLAIR transcripts at the FLC locus. Untranslated regions (UTR) are indicated by grey boxes and exons by black boxes. kb, kilobase. d, FRI–GFP was detected after immunoprecipitation by western blots in ChIP experiments. Ponceau staining was used as the loading control. Data are representative of three independent experiments. For gel source data, see Supplementary Fig. 1. e, f, FRI–GFP ChIP across the FLC locus (e), STM and ACT locus (f) in plants expressing FRI–GFP. Non-tagged FRI was used as negative control. The exact distance from TSS referred to (c). Data are represented as mean ± s.d. of three independent biological experiments with two technical repeats. Two-way ANOVA was performed with P values adjusted by Sidak’s multiple comparisons test. g, Unspliced FLC transcript level in NV and 2WV plants with the indicated backgrounds, measured by RT–qPCR. Data are presented as mean ± s.e.m. of three biologically independent experiments. h, Representative images of nuclei expressing FRI–GFP (green) sequentially hybridized with intronic smFISH probes for COOLAIR (red). DNA was labelled with DAPI (blue). n= 327 cells. Scale bars, 5 μm. i, j, Relative transcript level of unspliced FLC and spliced FLC in the indicated plants measured by RT–qPCR. Data were presented as mean ± s.e.m. of three independent biological replicates. Two-way ANOVA was performed with P values adjusted by Sidak’s multiple comparisons test. k, l, Relative transcript level of FRI mRNA and unspliced FLC in NV and 2WV plants with the indicated genotype, measured by RT–qPCR. Data were presented as mean ± s.e.m. of three biologically independent experiments (k) and with two technical repeats (l). Two-way ANOVA was performed with P values adjusted by Sidak’s multiple comparisons test. m, FLC transcriptional shutdown rate indicated by -Slope by Linear Regression of unspliced FLC in (l). Mean ± s.e.m., n=6 replicates over 3 biologically independent experiments. P value was through two-tailed t test with Welch’s correction

