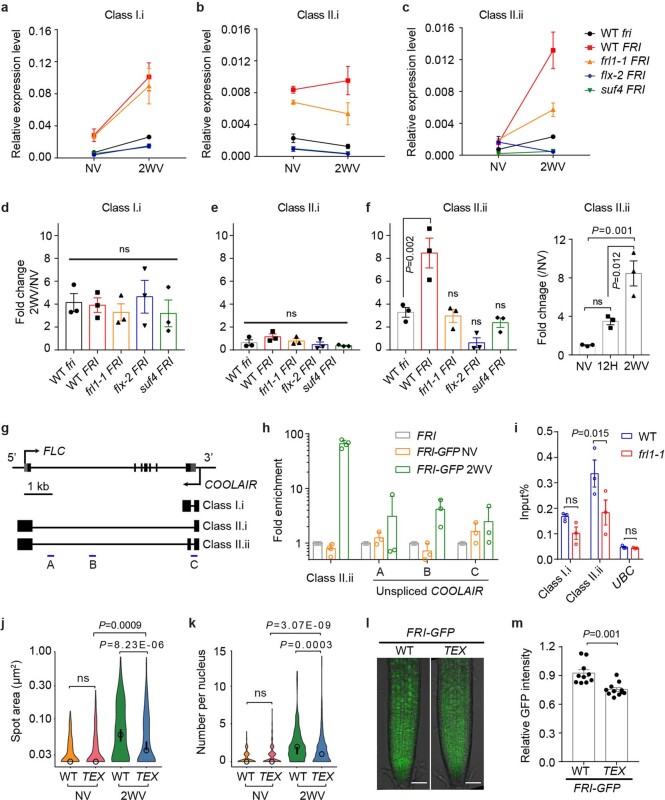
Extended Data Fig. 9. The association of FRI and COOLAIR is disturbed in FRI-complex mutants.
a–c, Relative transcript level of spliced COOLAIR isoforms in NV and 2WV plants with the indicated genotype, measured by RT–qPCR. Data are presented as mean ± s.e.m. of three independent biological replicates. d–f, Fold change of spliced COOLAIR expression in 2WV plants relative to NV plants in the indicated backgrounds. Fold change of Class II.ii in 12 h cold treated plants (12H) relative to NV was compared to 2WV on the right in (f). Data are presented as mean ± s.e.m. of three independent biological replicates. One-way ANOVA was performed with P values adjusted by Sidak’s multiple comparisons test. ns, no significance. g, Schematic illustration of FLC and COOLAIR transcripts at the FLC locus. Untranslated regions (UTR) are indicated by grey boxes and exons by black boxes. kb, kilobase. h, RNA-IP assay of unspliced COOLAIR enriched by FRI–GFP in NV and 2WV plants. COOLAIR enrichment in FRI–GFP is normalized to non-tagged FRI. Data are presented as mean ± s.e.m. of three independent biological replicates. Although there are differences of the fold enrichment between NV and 2WV samples, no statistical significance was detected (two-way ANOVA). Class II.ii was shown as control. Amplicons for unspliced COOLAIR are shown in (g) by blue bars. i, RNA-IP assay of spliced COOLAIR enriched by FRI–GFP in 2WV plants in WT and frl1-1 backgrounds with UBC as control. Data are presented as mean ± s.e.m. of three independent biological replicates. Two-way ANOVA with adjustment by Sidak’s multiple comparisons test. ns, no significance. j, k, Quantification of FRI–GFP nuclear condensate area (j) and number per nucleus (k) in root cells in Fig. 3e. An open circle indicates the median of the data and a vertical bar indicates the 95% confidence interval (CI) determined by bootstrapping. Numbers of nuclear condensates measured in (j) were 114 (NV-WT), 142 (NV-TEX), 435 (2WV-WT) and 500 (2WV-TEX). Numbers of nuclei analysed in (k) were 262 (NV-WT), 214 (NV-TEX), 199 (2WV-WT) and 293 (2WVV-TEX). At least 10 plants were analysed for each treatment. One-way ANOVA with adjustment by Sidak’s multiple comparisons test. ns, no significance. l, Representative confocal microscopic images of FRI–GFP root tips in 2WV WT and TEX plants. Scale bars, 50 μm. m, Quantification of the fluorescence intensity in (l). Data are represented as mean ± s.e.m., n=10 (WT) and 11 (TEX) roots. Two-tailed t test with Welch’s correction

