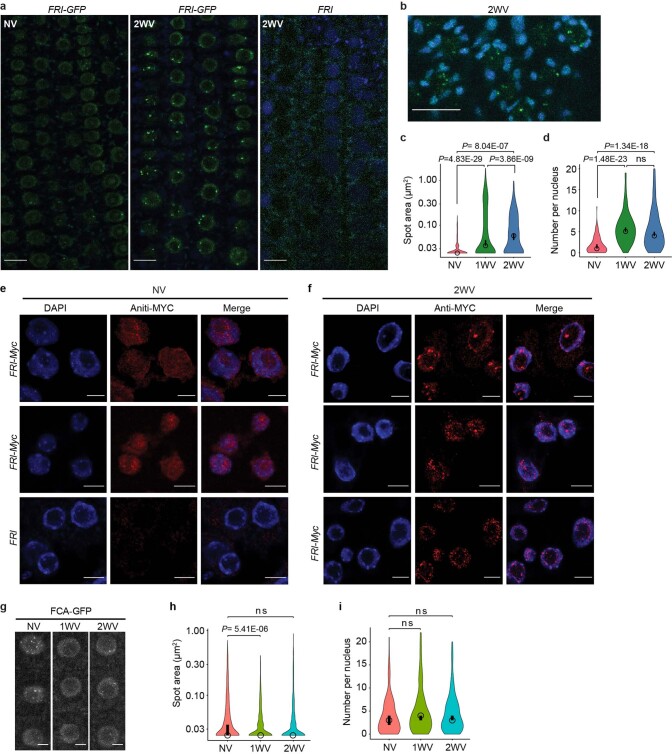
Extended Data Fig. 2. Cold promotes FRI nuclear condensates in both root and leaf cells.
a, Single confocal images of NV and 2WV Arabidopsis root tip nuclei expressing FRI–GFP (green) with 2WV non-tagged FRI as a negative control. Data are represented of three independent experiments. b, Confocal images of 2WV Arabidopsis leaf nuclei expressing FRI–GFP (green). Maximum intensity projections of Z-stacks spanning the entire width of the nucleus were applied. Autofluorescence was unmixed with lambda mode (blue) (see Methods). a, b, Scale bars, 10 μm. c, d, Quantification of FRI–GFP nuclear condensate area (c) and number per nucleus (d) in root cells in Fig. 1a. An open circle indicates the median of the data and a vertical bar indicates the 95% confidence interval (CI) determined by bootstrapping. n= 391 (NV), 904 (1WV) and 494 (2WV) condensates (c) and n=181 (NV), 144 (1WV) and 130 (2WV) nuclei (d). More than 10 plants were analysed. Comparison of mean by two-way ANOVA with adjustment (Sidak’s multiple comparisons test). ns, no significance. e, f, Representative confocal immunofluorescence images of subnuclear localization of FRI–Myc (red) in NV (e) and 2WV (f) Arabidopsis root cells. Non-tagged FRI was used as a negative control. DNA was stained by DAPI (blue). Scale bars, 5 μm. g, Confocal images of Arabidopsis root tip nuclei expressing FCA–GFP after 1 week (1WV) and 2 weeks (2WV) of cold treatment. Maximum intensity projections of Z-stacks spanning the entire width of the nucleus were applied. Scale bars, 5 μm. h, i, Quantification of FCA–GFP nuclear condensate area (h) and number per nucleus (i) in root cells. An open circle indicates the median of the data and a vertical bar indicates the 95% confidence interval (CI) determined by bootstrapping. Numbers of nuclear condensates measured in (h) were 655 (NV), 839 (1WV) and 613 (2WV). Numbers of nuclei analysed in (i) were 163 (NV), 148 (1WV) and 126 (2WV). At least 10 plants in each condition were analysed. Comparison of mean by one-way ANOVA with adjustment (Sidak’s multiple comparisons test). ns, no significance

