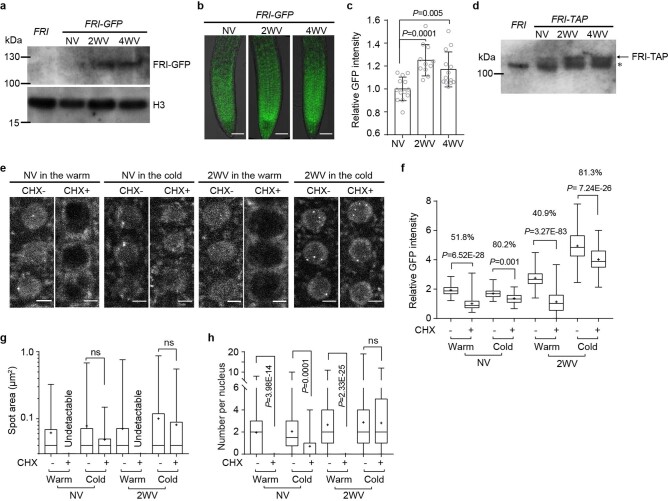
Extended Data Fig. 5. Stability of FRI–GFP is increased in the cold.
a, Nuclear FRI–GFP protein level in NV, 2WV and 4WV FRI–GFP transgenic plants as determined by western blots. Non-tagged FRI was used as a negative control. H3 was used as nuclear protein loading control. Data are representative of two independent experiments. For gel source data, see Supplementary Fig. 1. b, c, Confocal microscopy images of FRI–GFP in root tips of NV, 2WV and 4WV FRI–GFP transgenic plants (b) and the quantification of the fluorescence signal (c). Scale bars, 50 μm. The fluorescence intensity in cold treated samples is normalized to NV samples. Data are presented as mean ± s.e.m.; n=15 (NV), 12 (2WV) and 13 (4WV) roots. Statistical analysis was via one-way ANOVA with adjustment (Sidak’s multiple comparisons test). d, Nuclear FRI–TAP protein level in NV, 2WV and 4WV plants expressing FRI–TAP as determined by western blots. Non-tagged FRI was used as a negative control. Asterisks indicate non-specific signals. Data are representative of two independent experiments. For gel source data, see Supplementary Fig. 1. e, Confocal microscopy of Arabidopsis root tip nuclei expressing FRI–GFP in NV or 2WV plants after treated with cycloheximide (CHX) in the indicated conditions for 24 h. For example, “NV in the cold” means plants grown in NV were kept in the cold for the 24h CHX treatment. Scale bars, 5 μm. f, Quantification of nuclear fluorescence intensity in (e). The relative intensity of CHX+ to CHX- in each treatment was indicated by percentage on top. n = 136, 122, 95, 107, 144, 153, 141 and 105 root nuclei (from left to right). g, h, Box plots showing the distribution of FRI–GFP nuclear condensate area and number in (e). Numbers of nuclear condensates measured in (g) were 226, 0, 138, 46, 270, 0, 282 and 238 (from left to right) and numbers of nuclei analysed in (h) were 113, 127, 66, 80, 94, 185, 95 and 85 (from left to right). f–h, At least 10 plants were analysed. Centre lines show median, box edges delineate 25th and 75th percentiles, bars extend to minimum and maximum values and ‘+’ indicates the mean value. Mean was compared by one-way ANOVA with adjustment (Sidak’s multiple comparisons test)

