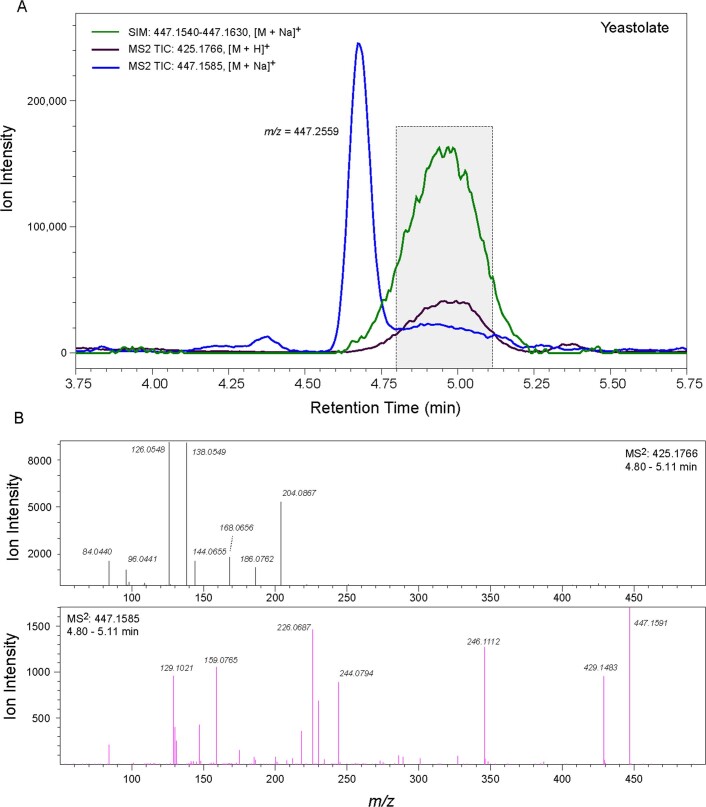
Extended Data Fig. 4. LC-MS Analysis of Commercial Autohydrolyzed Yeast (Yeastolate).
Supplemental Fig. 10: LC-MS Analysis of Commercial Autohydrolyzed Yeast (Yeastolate). A) LC-MS traces using Selected Ion Monitoring (SIM) of the m/z values for chitobiose as the sodiated ion, and the Total Ion Chromatograms (TIC) for MS2 analysis of the protonated and sodiated species. B) MS2 spectra for the m/z values of the protonated (top) and sodiated (bottom) forms of chitobiose. Spectra summed over the time window indicated in the grey box (4.80-5.11 min).

