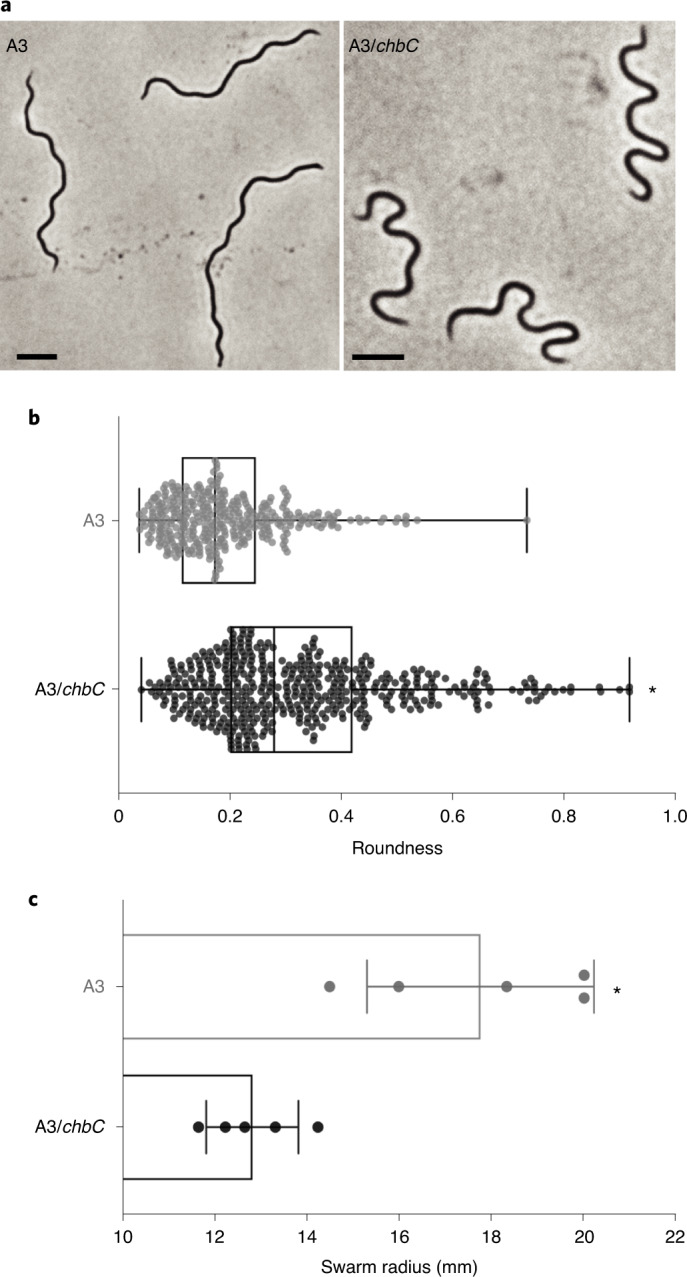
Fig. 5. Morphological and motility defects in A3/chbC mutant bacteria.

a, Comparative, quantitative, population-level morphological analysis of A3 and A3/chbC strains. Both strains were cultured to mid-log(exponential growth), fixed with paraformaldehyde to preserve cellular helicity and imaged on agarose pads by phase-contrast microscopy. Scale bar, 5 µm. b, Morphometric, population-level analysis of differences in helical pitch between strains estimated by the object analysis feature Roundness. Box plots from values attained from n = 360 (A3) and n = 481 (A3/chbC) strains are shown. Each dot indicates the values attained from an individual cell. Statistical significance was determined using the two-tailed, unpaired Student’s t-test (P = 6.67 × 10⁻⁹). c, Swarm plate assay to measure differences in bacterial motility. Liquid A3 and A3/chbC cultures were enumerated and equal amounts used to inoculate the same semisoft agar plate, equidistant from each other. After 5 d, swarming distance was measured from five replicate plates. Statistical significance (*) was determined using the two-tailed, unpaired Student’s t-test (P = 0.0031).
