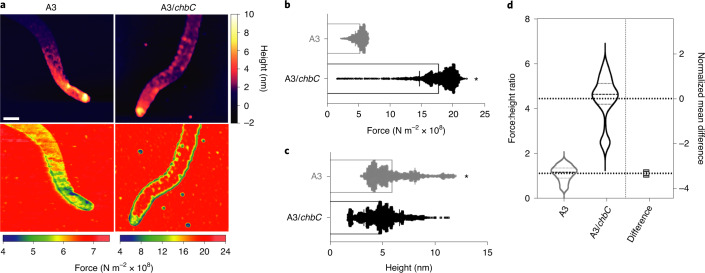
Fig. 6. Biophysical properties of B. burgdorferi peptidoglycan with reduced levels of G-G-anhM.
a, AM–FM topological mapping (upper) and elasticity measurements (lower) using the Hertz contact model on purified peptidoglycan sacculi from each strain. Note that measurements collected for each sample had dramatically different force ranges, which is reflected in colour maps (below). These images represent data collected from eight independent sacculi per sample. Scale bar, 400 nm. b, Line-scan analysis of force measurements collected from each pixel in seven independent sacculi per sample. Statistical significance (*) was assessed using the two-tailed, unpaired Student’s t-test (P = 5.3 × 10⁻⁵). c, The same line scans in b were used to measure pixel-level height differences in each sample. Statistical significance (*) was assessed using the two-tailed, unpaired Student’s t-test (P = 0.0028). d, Fold-change of the elasticity of A3/chbC peptidoglycan, relative to A3, normalized by peptidoglycan height.

