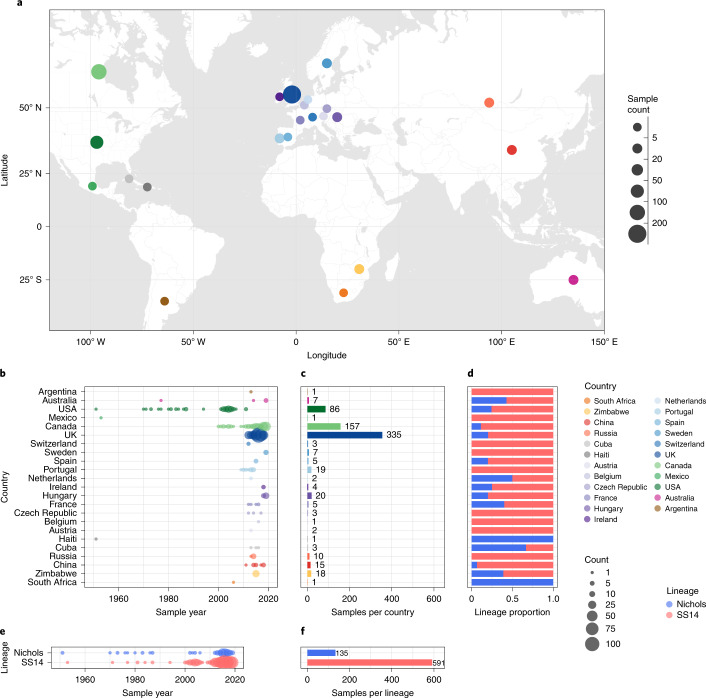
Fig. 1. Global distribution of 726 T. p.pallidum partial genomes.
a, Map of sampled countries for 726 partial (>25% of genome positions) genomes. Circle size corresponds to total number of genomes (binned into categories), and colour corresponds to country. Country coordinates used are the country centroid position, except for Russia (where the centroid for the Tuva Republic is used) and Mexico (where the location of Mexico City is used). Map tiles by Stamen Design (CC-BY 3.0), map data by OpenStreetMap (ODbl). b, Temporal distribution of samples by country. Size of circle indicates number of samples for that year. Three samples from Baltimore (USA) had uncertain sampling dates (1960–1980) and were set to 1970 for plotting dates in b and e. Genomes derived from passaged variants of the Nichols-1912 isolate or those with uncertain collection dates are not shown in plotted timeline (b, e). c, Total count of samples by country. d, Relative proportion of country samples corresponding to each TPA lineage (where only one sample was present per country, this shows the lineage it corresponds to). e, Temporal distribution of the samples by TPA lineage. f, Total count of samples by TPA lineage.

