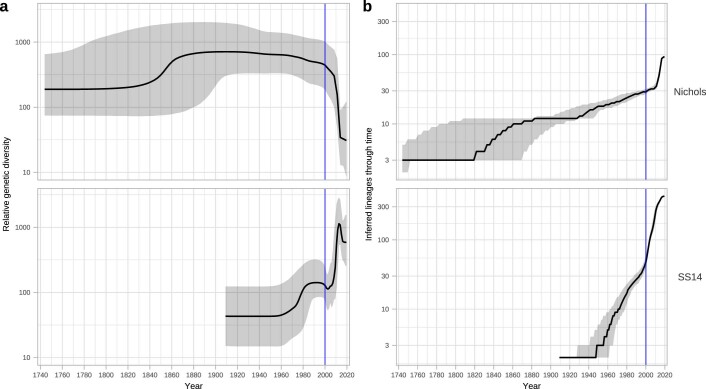
Extended Data Fig. 7. Independent analysis of SS14 and Nichols phylodynamics shows differential patterns of expansion and decline.
A – Independent Bayesian Skyline plots for Nichols- and SS14- lineages. B – Independent lineages through time plot for Nichols- and SS14-lineages. Skyline analysis indicates expansion of SS14-lineage after 2000 coincided with a decline of Nichols-lineage. However, analysis of lineage accumulation through time shows that both SS14 and Nichols continued to expand after 2000; whilst this is visible as a steep slope from 2000 in SS14, rapid expansion for Nichols occurred after 2010.

