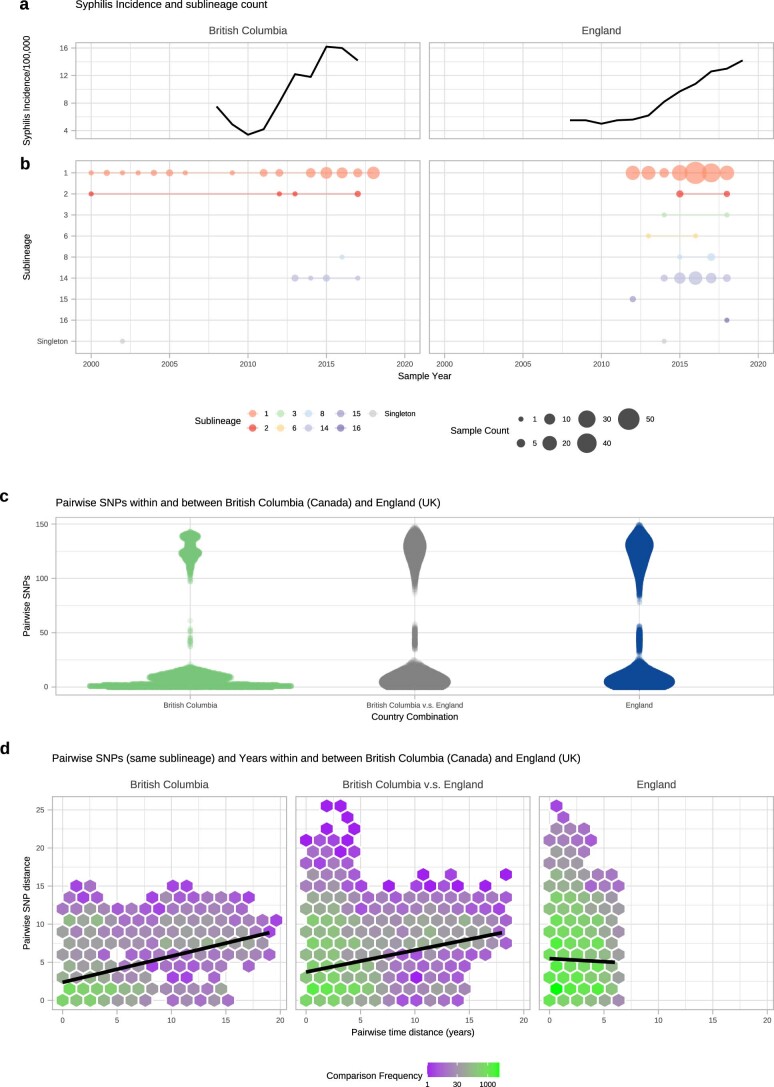
Extended Data Fig. 9. Sharing of sublineages and closely related strains within and between British Columbia (Canada) and England (UK).
A- Syphilis incidence per 100,000 population by year for British Columbia, (Canada) and England (UK) using currently published data. B- TPA sublineage counts for each year, using high quality genomes from British Columbia (n = 84) and England (n = 240). British Columbia samples collected from 2000-2018, English samples collected from 2012-2018. C- Pairwise comparison of SNP distance distributions from samples within and between British Columbia and England. D- Comparison of SNP distance and temporal distance within and between British Columbia and England. The plot is divided into hexagonal bins, with the colour of each hexagon representing the number of comparisons (white = none, purple = few, green = many, see scale). Linear regression lines also shown (95% CI not visible).

