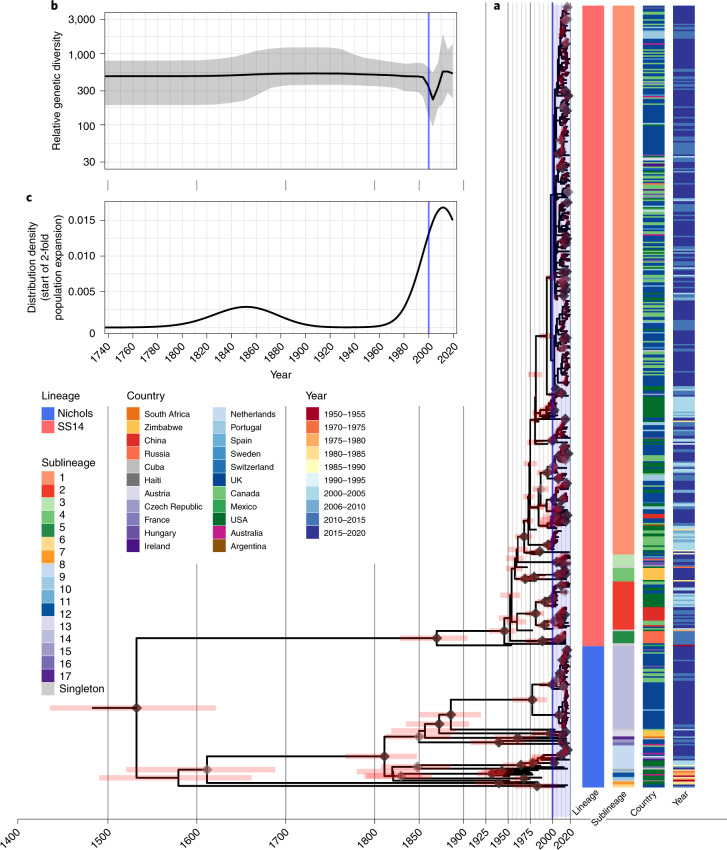
Fig. 3. Bayesian maximum-credibility phylogeny of 520 TPA genomes shows population contraction during the 1990s, followed by rapid expansion from the early 2000s onwards.
a, Time-scaled phylogeny of 520 TPA genomes. Node points are shaded according to posterior support (black ≥96%, dark grey >91%, light grey >80%). Pink bars on nodes indicate 95% highest posterior density intervals. Blue line and shaded area highlight post-2000 expansion of lineages. b, Bayesian Skyline plot of genetic diversity shows small population expansion and contractions during the nineteenth and twentieth centuries, followed by a sharp decline and rapid re-emergence during the 1990s and 2000s. c, Posterior distribution of start dates for a 2-fold expansion above Skyline mean shows strong support for expansion after 1990 in 68.6% (9,263/13,503) of trees.

