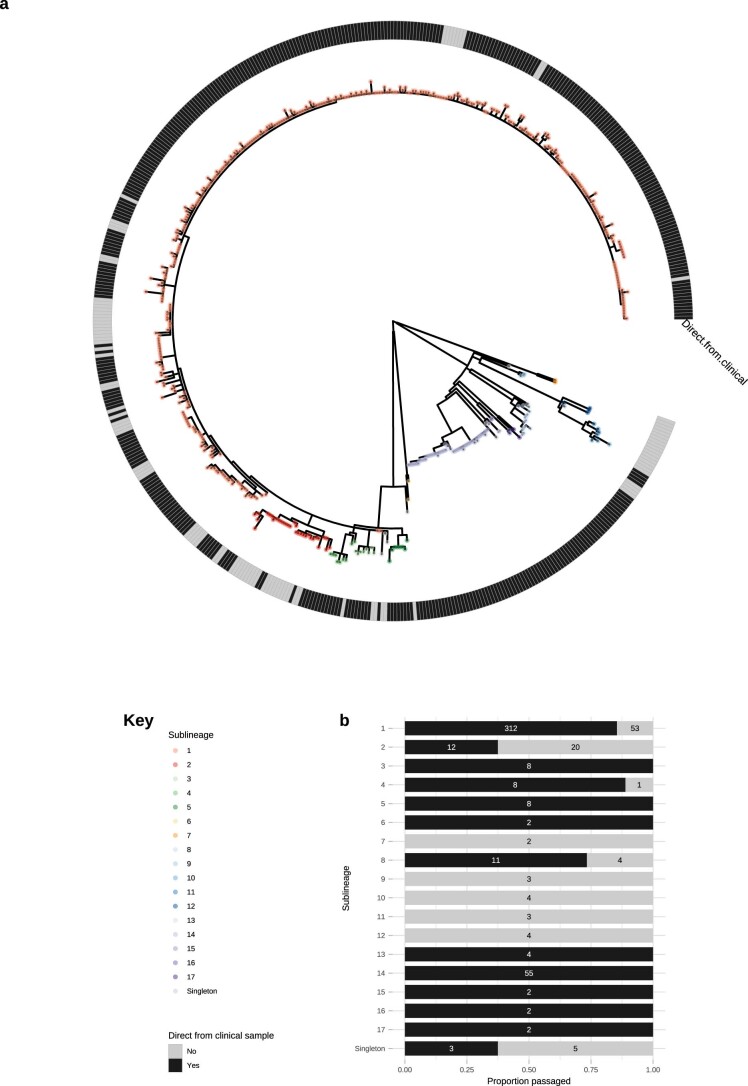
Extended Data Fig. 5. Finescale analysis of 528 high quality TPA genomes and sublineages, showing distribution of samples sequenced directly from clinical samples and those passaged in rabbit model.
A – Whole genome phylogeny showing distribution of samples sequenced directly from clinical sample or rabbit-passaged. B – Distribution of samples sequenced directly from clinical sample and rabbit-passaged samples according to sublineage, showing proportion (bar) and exact count (number). For both A and B, plots are coloured according to being directly sequenced from clinical samples (Black) or after rabbit passage (grey). Samples passaged in rabbits are distributed throughout the global TPA phylogeny, and present in 9/17 sublineages. Older samples from before 2000 were isolated via rabbit passage, and dominate extinct clusters, as well as clustering close to the most recent common ancestor of contemporary sublineages such as SS14 sublineage 1.

