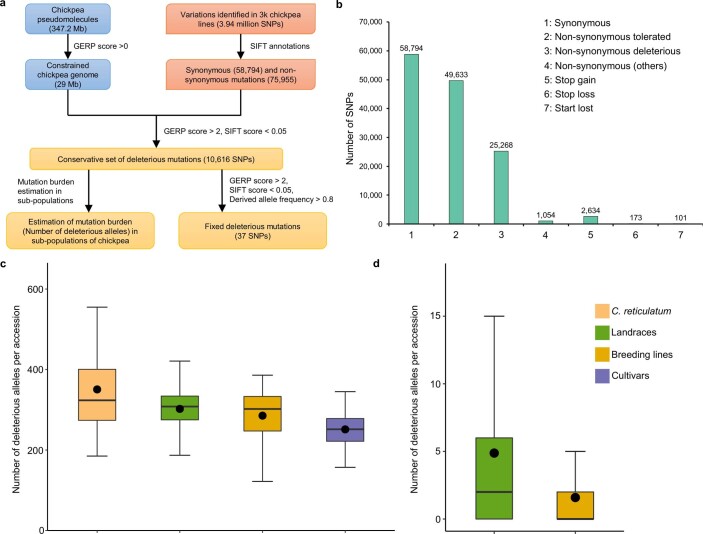
Extended Data Fig. 8. Genetic loads in chickpea.
a) A snapshot of steps and parameters used to estimate the mutation burden and fixed deleterious alleles. b) Variant annotation using SIFT revealed higher non-synonymous mutations, of which non-synonymous deleterious variants were used to identify deleterious mutations. c) Mutation burden analysis indicated a 17.88% decrease (two-tailed Welch’s t-test; t = 2.525, df = 27, p = 0.01772, CI = 95%) in mutation burden in cultivated (n = 2987) as compared to progenitor (C. reticulatum; n = 28). d) Mutation burden for genomic regions under selection showed that landraces (n = 2439) contained 206.91% higher (two-tailed Welch’s t-test, t = −17.087, df = 1645, p = 2.195676 × 10−60, CI = 95%) deleterious mutations than breeding lines (n = 396). The black solid dots in box plots represent mean values for the respective population. Each of the box plots shows the upper and lower whisker, the 25% and 75% quartiles, the median (as solid line) and the mean (black dot)

