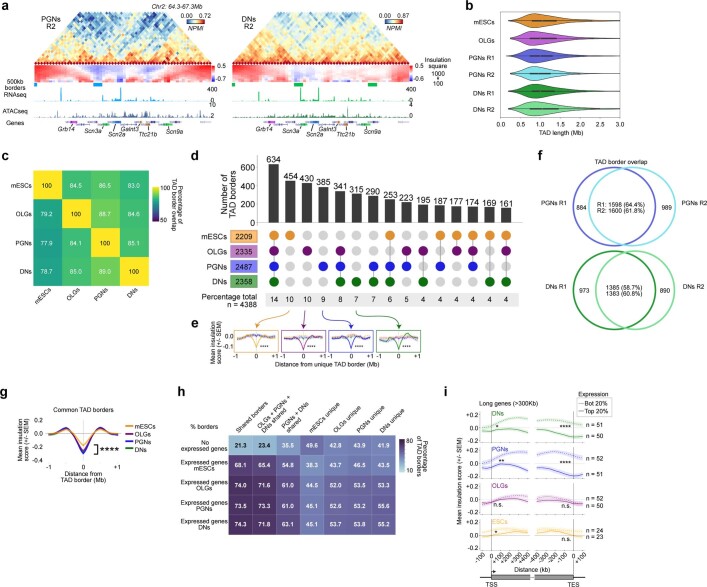
Extended Data Fig. 5. Identification of contact density changes, TAD borders, and differences in contacts between cell types.
a, GAM contact matrices for replicates 2 obtained from PGNs and DNs, within a 2-Mb region (50-kb resolution; Chr2:64,800,000-66,800,000). Contact density maps, TAD borders, pseudobulk scRNA-seq, and pseudobulk scATAC-seq tracks are indicated for each cell type below matrices. b, Distributions of TAD lengths in each GAM dataset. TAD length was calculated as the distance between two boundary points (defined as lowest insulation score point within a boundary). c, Pairwise comparisons of TAD boundary overlap between cell types. TAD boundaries were determined using insulation square method, using square size of 500kb, and the minimum score considered +1 bin on either side, giving a constant total of 150-kb TAD boundaries. The matrix of percentages of common TAD boundaries is not symmetrical as the percentage of overlap between boundaries varies with the direction of the comparison. The first dataset in the comparison is specified on the y axis, and the second on the x-axis. d, Four-way comparison of TAD boundary overlap between all cell types is shown as an UpSet plot. TAD boundaries were defined as in 5c. e, Average insulation score profiles centered on cell-type specific TAD borders show low average insulation scores in the cell type where the borders are detected, with highly significant differences at central border window with all other cell types (two-sided Mann-Whitney U test for central TAD border window in unique cell-type border and compared to all other cell types; ****p < 0.0001; p = 1.1x10⁻²⁰, 1.2x10⁻¹⁷, and 1.0x10⁻¹⁷ for mES cells compared to OLGs, PGNs and DNs, respectively; p = 6.0x10⁻¹⁸, 2.4x10⁻¹², and 4.1x10⁻¹¹ for OLGs compared to mES cells, PGNs and DNs, respectively; p = 1.0x10⁻¹⁰, 2.0x10−07, and 1.3x10−09 for PGNs compared to mES cells, OLGs and DNs, respectively; and p = 6.7x10⁻¹⁰, 1.8x10⁻¹², and 8.5x10−08 for DNs compared to mES cells, OLGs and PGNs, respectively). f, Venn plots show overlap between TAD boundaries in PGN or DN replicates 1 and 2. Overlaps were performed by comparing replicate 1 (R1) to replicate 2 (R2), and conversely R2 to R1. g, Average insulation score profiles of common TAD borders (first UpSet plot group) centered on the lowest insulation point within each TAD border are shown for each cell type (two-sided Mann-Whitney test for central TAD border window in mES cell border and compared to each brain cell-type; ****p < 0.0001; p = 8.6x10⁻¹⁰, 1.5x10⁻¹⁸, and 1.0x10⁻¹⁸ for mES cells compared to OLGs, PGNs and DNs, respectively). h, Percentage of TAD borders containing expressed genes (R-log 2.5) in each cell type for the groups shown in d. Higher percentage of borders contain expressed genes in groups with shared borders in two or more cell types. In all groups, brain cells have a higher percentage of borders with expressed genes compared to mES cells. i, Average insulation score profiles at the gene TSS or TES for genes >300kb in length, using insulation square size 500kb. The top and bottom 20% expressing genes were determined using the length-normalized number of reads covering the gene body (length-scaled RNA Reads per Million; lsRRPM). The top expressing long genes have significantly lower insulation scores compared to the lowest expressed genes, at both the TSS and TES, in DNs and PGNs, while mES cells are lower at the TSS only, and OLGs show no detectable difference (two-sided Mann-Whitney test at TSS or TES windows; *p < 0.05, **p<0.01, ***p < 0.001, ****p<0.0001; p-values at the TSS, p = 0.02, 0.009, 0.328, 0.027 for DNs, PGNs, OLGs and mES cells, respectively; p-values at the TES, p = 7.2x10⁻⁶, 1.8x10⁻⁸, 0.323, 0.177 for DNs, PGNs, OLGs and mES cells, respectively).

