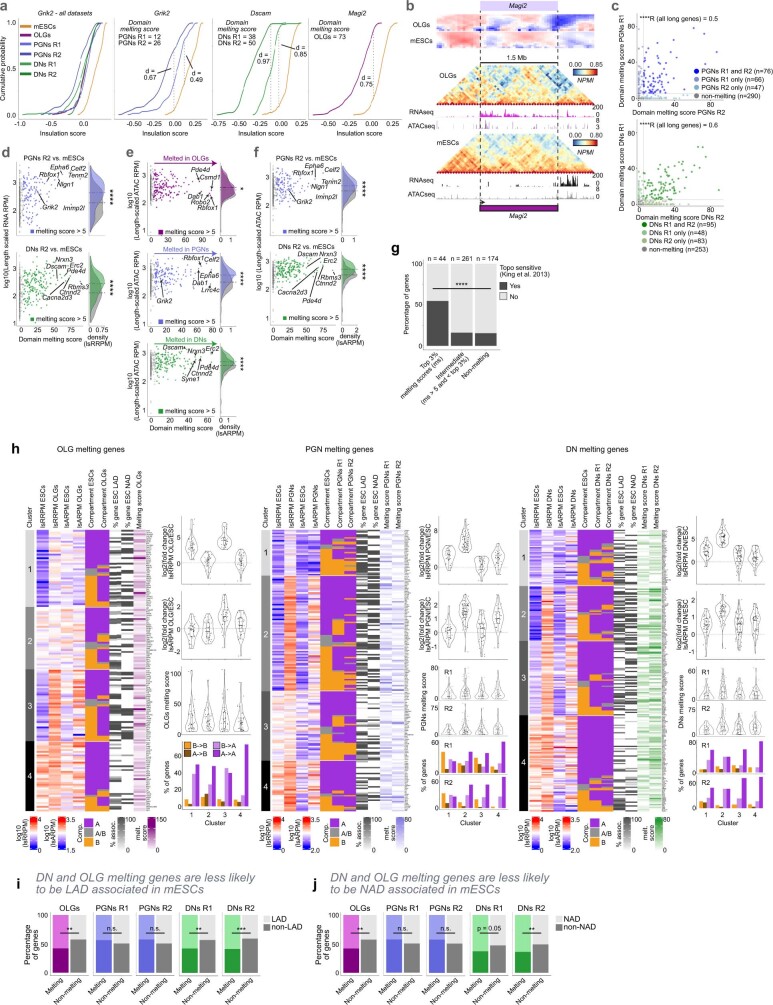
Extended Data Fig. 6. Identification of domain melting in long expressed genes.
a, Cumulative probability of insulation square scores ranging from 100 – 1000 kb for Grik2 in all cell types and replicates (left). Comparison between PGNs replicates 1 and 2 and mES cells, with maximum distance (d) and TAD melting scores (right). Cumulative probability distributions of insulation scores and domain melting scores for Grik2 in PGNs, Dscam in PGNs, and Magi2 in OLGs (right). All genes were compared to mES cells, with maximum distance (d) indicated for each comparison. b, Example of domain melting for Magi2 in OLGs. c, Correlation of replicate domain melting scores for replicates 1 and 2 in PGNs and DNs (two-sided Pearson’s R product-moment correlation was calculated for all 479 long genes; ****p < 2.2x10⁻¹⁶ for both PGNs and DNs;). d, Domain melting scores for each gene (n = 479) in PGNs R2 and DNs R2, compared to mES cells. Genes with melting scores > 5 are coloured in each cell type. Density estimates of length-scaled RNA reads per million (lsRRPM) transcription levels are shown for genes with melting scores > 5 (coloured by cell type) compared to non-melting genes (grey; two-sided Wilcoxon rank-sum test; ****p = 5.4x10⁻⁹ and 6.5x10⁻¹¹ in PGNs and DNs, respectively). e, Melting genes have higher density of open chromatin regions throughout their gene bodies (length-scaled ATAC-seq RPM values; lsARPM), especially in PGNs and DNs, and to a minor extent in OLGs (two-sided Wilcoxon rank-sum test; *p<0.05, ****p<0.0001; p-values from left to right, p = 0.015, 4.0x10⁻¹⁰, 1.3x10⁻⁷). f, Domain melting scores compared to length-scaled ATAC-seq reads per million (lsARPM) transcription levels for each gene (n = 479) in PGNs R2 and DNs R2. Density estimates of lsARPM open chromatin levels are shown for genes with melting scores > 5 (coloured by cell type) compared to non-melting genes (grey; two-sided Wilcoxon rank-sum test; ****p = 2.6x10⁻⁶ and 2.2x10⁻¹⁶ in PGNs and DNs, respectively). g, Long genes within the top 3% melting scores in any cell-type (24 of 44 genes) have a higher likelihood of sensitivity to topoisomerase inhibition45 compared to genes with intermediate melting scores (42 of 261) and genes with no domain melting (27 of 174; two-sided χ2 test; ****p-value = 5.0e-9). h, Heatmaps of genes with domain melting in OLGs, and with domain melting in at least 1 replicate for PGNs and DNs, clustered by change in transcription level (length-scaled RNA RPM; lsRRPM) from mES cells to brain cell type. ATAC-seq (length-scaled ATAC RPM; lsARPM), compartments in each cell-type, and percentage of mES cell lamina- and nucleolus-associated domain (LAD47 and NAD48, respectively) in mES cells are shown for comparison. The density of the change in lsRRPM, lsARPM, and melting scores are shown for each cluster (violin plots on right). Compartment changes are shown as bar plots (lower right). i, mES cell LAD association (defined as > 50% of gene body with feature) for genes with or without melting domains in brain cell types and replicates. For DNs and OLGs, genes with domain melting were less likely to be LAD associated in mES cells, compared to non-melting genes (Two-sided Fisher’s exact test; **p < 0.01, ***p<0.001; p-values from left to right, p = 0.001, 0.272, 0.209, 0.003, 0.0001). j, mES cell NAD association (defined as > 50% of gene body with feature) for genes with or without melting domains in brain cell-types and replicates. For DNs and OLGs, genes with domain melting were less likely to be NAD associated in mES cells, compared to non-melting genes (Two-sided Fisher’s exact test; *p < 0.05, **p < 0.01; p-values from left to right, p = 0.003, 0.272 0.209, 0.055, 0.008).

