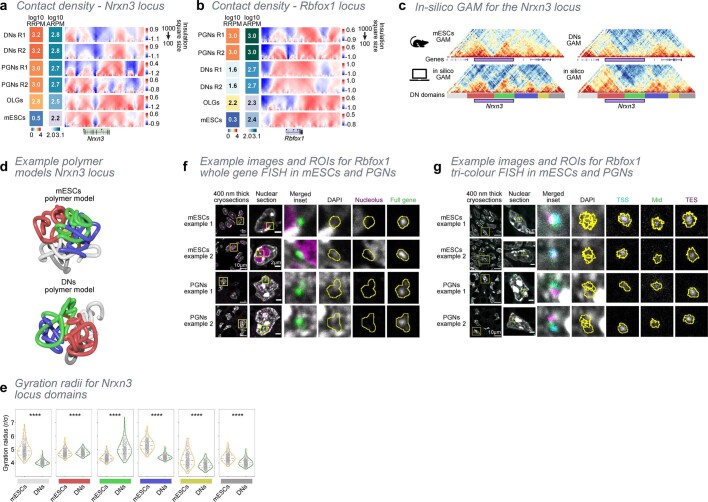
Extended Data Fig. 7. Characteristics and mechanisms of domain melting in long expressed genes.
a, Contact density maps for each cell type and replicate, at the Nrxn3 locus, calculated using insulation square sizes ranging from 100 − 1000 kb. Contact density is reduced in PGNs and DNs replicate 2 (R2), similar to R1 but occurring in slightly differing regions of the gene. b, Contact density maps for each cell type and replicate, at the Rbfox1 locus. Contact density is reduced in OLGs and PGNs R2, in the same region as R1. c, Ensembles of polymer models were produced for the Nrxn3 locus in mES cells and in DNs from experimental GAM data using PRISMR modelling (n= 450). The quality of the models was verified by applying in-silico GAM to the ensemble of polymers and comparison between NPMI-normalized contact matrices from in-silico and experimental immunoGAM (Pearson r = 0.72 and 0.79 for mES cells and DNs, respectively). Colour bars below in-silico matrices highlight the position of domains in DNs and are used to colour the polymer examples shown in Fig. 3c and Extended Data Fig. 7d. d, Additional examples of polymer models for the Nrxn3 locus in mES cells and DNs. The Nrxn3 melted TAD is represented by the green coloured region and is more decondensed in DNs than mES cells. See Fig. 3c for location and colouring of the domains. e, Distribution of gyration radii of all domains in polymer models for mES cells and DNs (see Fig. 3c for location and colouring of the domains; n= 450, two-sided Mann-Whitney test between mES cells and DNs; dashed lines indicate quartiles; ****p<0.0001; domains from left to right p= 3.0e-151, 0.0005, 1.1e-92, 2.0e-147, 7.3e-40, 2.5e-67). f, Exemplar images of whole gene cryo-FISH for Rbfox1 (green) in mES cells and PGNs, using probes that label the whole gene. Nucleoli (purple) were detected by an anti-nucleophosmin 1 antibody. Yellow inset of the ~400 nm section shows a single nucleus. Inset on nuclear section (yellow box) with Rbfox1 FISH signal and each imaging channel. Yellow outline indicates region of Rbfox1 signal used for area measurement and localization to nuclear landmarks. g, Exemplar images of tri-colour cryo-FISH for Rbfox1 TSS (teal), Mid (green) and TES (purple) in mES cells and PGNs (see Fig. 3e for schematic). Yellow inset of the 400 nm section shows a single nucleus. Inset on nuclear section (yellow box) is shown for all three FISH signals, and each imaging channel separately. Yellow outline indicates region of Rbfox1 signal used for center of mass distance measurements.

