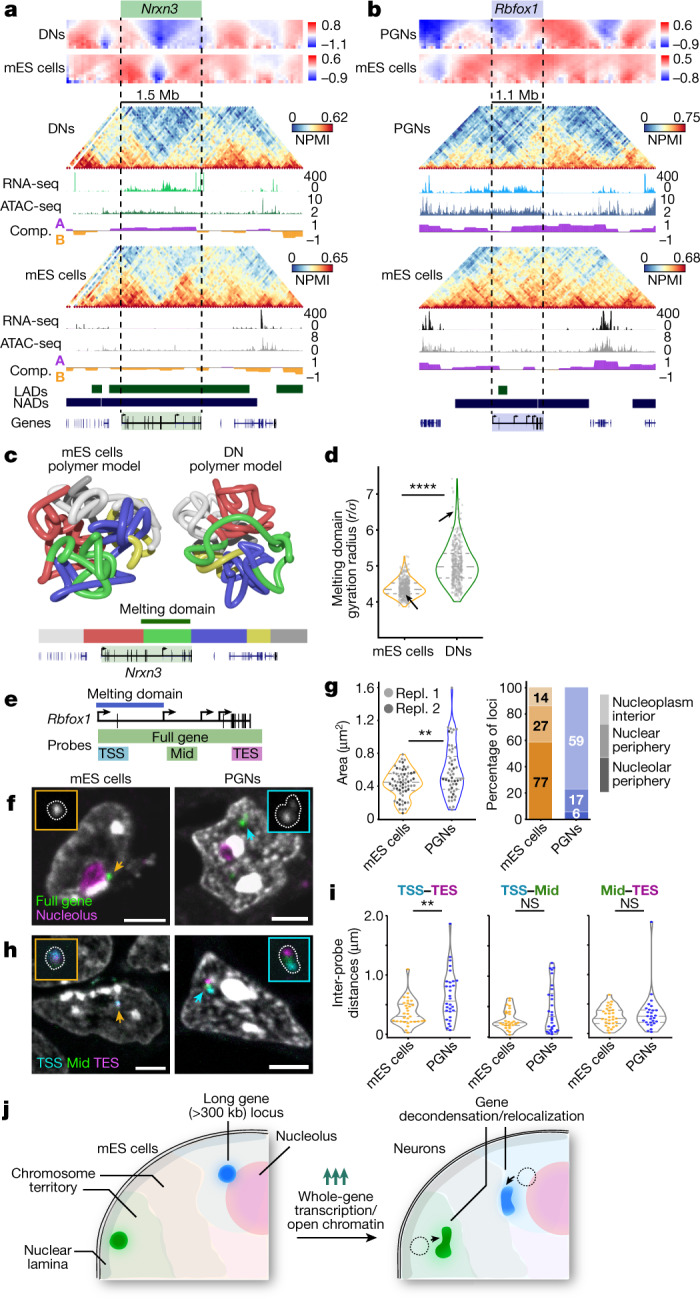
Fig. 3. Extensive decondensation and relocalization of highly expressed long neuronal genes.

a, b, Examples of two melting genes. Nrxn3 occupies two dense TADs in mES cells but melts in DNs where it is most highly expressed and accessible (a; chromosome 12: 87.6–92.4 Mb). Rbfox1 is highly condensed in mES cells and melts in PGNs where it is highly expressed and accessible (b; chromosome 16: 4.8–9.8 Mb). Compartment tracks are shown for each cell type, and published lamina-associated domains (LADs47) and nucleolus-associated domains (NADs48) for mES cells. c, Polymer models show extensive Nrxn3 melting in DNs compared to mES cells. Colour bars shows DN domain positions. d, Gyration radii of green melting domains are significantly higher in DNs than in mES cells (****P = 1.1 × 10−92; two-sided Mann–Whitney test, n = 450). Arrows indicate positions of exemplar models. e, Genomic regions covered by cryo-FISH probes across the entire Rbfox1 gene, or targeting the gene TSS, middle of the coding region (Mid) or TES (Supplementary Table 11 contains the probe list). f, Rbfox1 (pseudocoloured green) occupies small, rounded foci in mES cells, often at the nucleolus periphery (immunostained for nucleophosmin 1, ref. 49; pseudocoloured purple). In PGNs, Rbfox1 occupies larger, decondensed foci away from nucleoli. Arrows indicate Rbfox1 foci in mES cells (orange) and PGNs (blue). Scale bars, 3 μm. g, Rbfox1 occupies significantly larger areas in PGNs than in mES cells (**P = 0.008; two-sided Mann–Whitney test; two experimental replicates (Repl. 1 and Repl. 2) with n = 13, 39 and 38, 25 respectively). Most Rbfox1 foci localize at the nucleolar periphery in mES cells, but away from the nucleolus in PGNs. h, Cryo-FISH experiments that target TSS, Mid and TES regions of Rbfox1 (pseudocoloured cyan, green, purple) show extensive separation in PGNs compared with mES cells. Arrows indicate Rbfox1 foci in mES cells (orange) and PGNs (blue). Scale bars, 3 μm. i, The TSS and TES regions of Rbfox1 are significantly more separated in PGNs than mES cells (two-sided Mann–Whitney test; **P < 0.01; from left to right, P = 0.003, P = 0.179, P = 0.331; NS, not significant). j, Schematics summarizing the melting of long genes in neurons, which is accompanied by locus relocalization away from repressive nuclear landmarks.
