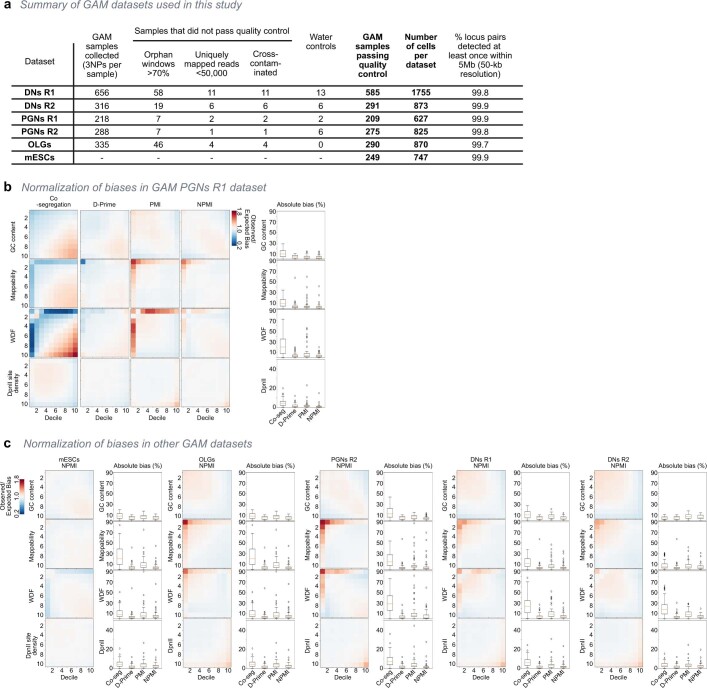
Extended Data Fig. 2. Normalization of immunoGAM data.
a, Summary of GAM datasets used in this study. VTA DNs were collected from two animals, an 8-week old wild-type mouse and a 10-week old mouse carrying a TH-GFP reporter. PGNs were collected from two 8-week old wildtype littermate mice. Cortical OLGs were collected based on detection of GFP expression from a 3-week old Sox10-cre-LoxP-GFP mouse. GAM data from mES cell (clone 46C) was previously published11, and available from the 4DNucleome portal after quality control (https://data.4dnucleome.org/; Supplementary Table 1). b, 50-kb windows for PGNs R1 were divided into equally sized groups depending on their GC content, mappability, window detection frequency (WDF) or DpnII restriction density. Heatmaps of mean observed/expected bias (represented as a fold change) are shown for co-segregation, D-prime (used for previous GAM normalizations3), PMI and NPMI normalizations. NPMI normalization results in the lowest absolute bias percentage for all tested categories (box plots on right). Box plot definitions were as follows: 25th percentile lower limit, 75th percentile upper limit, and center line as the median; interquartile range (IQR) was 25th to 75th percentile; upper whisker was (75th percentile + (IQR*1.5)), lower whisker was (25th percentile – (IQR*1.5)) or zero if negative; outliers outside the whiskers were indicated with open circles. n = 100 for each bias tested, representing all combinations of deciles in PGNs R1. c, Absolute bias analysis for remaining immunoGAM datasets. Box plot definitions were as in panel b.

