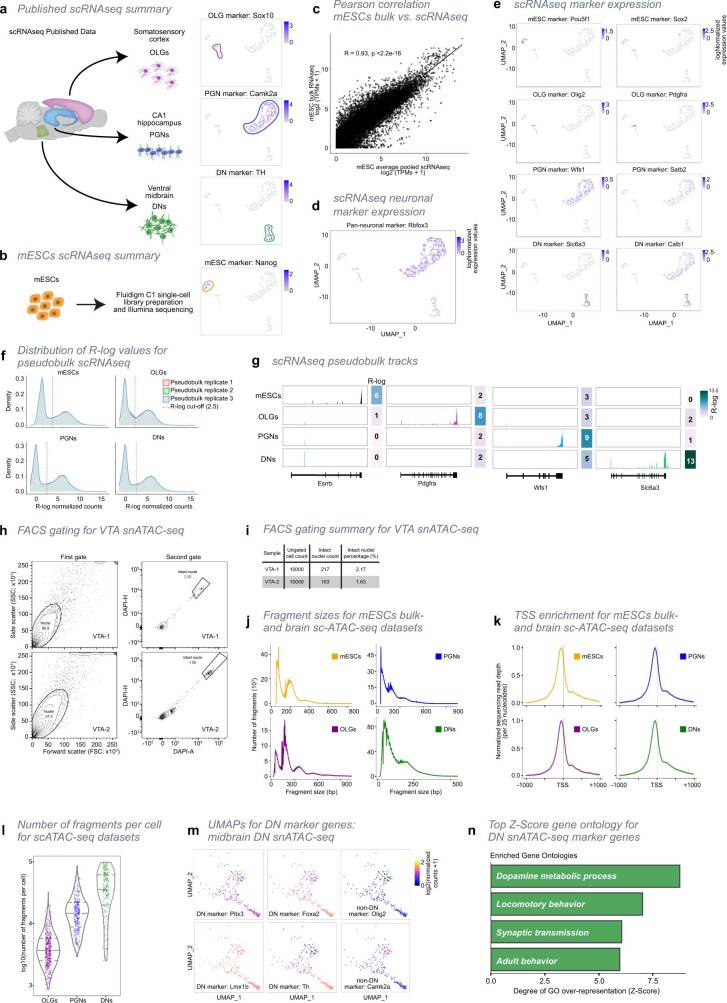
Extended Data Fig. 4. Curation of scRNA-seq and snATAC-seq data from published datasets and datasets produced for the present study.
a, Schematic representation of scRNA-seq datasets used in this study. We collected published scRNA-seq datasets from cortex and hippocampus, and produced scRNA-seq from midbrain. From each of the brain tissues, we select the specific cell types that were matched with those collected for the presented GAM data. The selected datasets from each cell type were combined and visualized through UMAP embedding, coloured by expression of each marker gene: Sox10 for OLGs, Camk2a for PGNs and Th for DNs. Cluster contours are drawn to highlight separation between cell types. All marker genes were found highly expressed in their respective cell types. b, scRNA-seq datasets were also generated from mES cells. UMAP clustering is coloured by the expression of Nanog. c, Pearson’s correlation plot of gene expression in mES cells (clone 46C) between published bulk26 versus single-cell RNA-seq. Average single-cell expression is highly correlated with bulk RNA-seq (two-sided Pearson’s R product-moment correlation; R = 0.93, p < 2.2x10⁻¹⁶). Only genes common to both datasets are represented (total genes in bulk dataset = 22822, total genes in single cell dataset = 23208, common to both = 22045). d, Single cell expression of Rbfox3, a pan-neuronal marker, overlaid on the UMAP of single cell transcriptomes. e, Additional examples of UMAPs for single cell transcriptomes of cell-type markers. Pou5f1 and Sox2 were used as markers for mES cells, Olig2 and Pdgfra for OLGs, Wfs1 and Satb2 for PGNs, and Slc6a3 and Calb1 for DNs. All markers show higher expression in their respective cell types. f, Distribution of regularized log (R-log) values for pseudobulk scRNA-seq datasets. For each cell type, cells were randomly partitioned into 3 pseudobulk replicates before pooling and normalizing reads. The distribution of R-log values is bi-modal for all cell types and pseudobulk replicates. To consider expressed genes for downstream analysis, a 2.5 R-log threshold (dashed red lines) was applied in all datasets. Genes with R-log 2.5 in all three pseudobulk replicates are considered expressed for that cell type. g, Example scRNA-seq pseudobulk tracks of sequenced reads for marker genes in each cell type. Tracks were RPKM normalized to allow for cell-type comparisons. Markers were: Esrrb for mES cells, Pdgfra for OLGs, Wfs1 for PGNs and Slc6a3 for DNs. All markers are specifically expressed in their respective cell types. h, Exemplar plots of fluorescence-activated cell sorting (FACS) and gating strategy in midbrain VTA samples. Two biological replicate samples from independent mice, VTA-1 (top) and VTA-2 (bottom) were sorted to determine percentage of intact nuclei. Debris was excluded with a first gate (left; SSC/FSC plots, n = 10000 for VTA-1 and VTA-2, a total of n = 200000 DAPI positive events were sorted) and damaged nuclei with a second gate using DAPI (right; DAPI-H/DAPI-A plots, n=8687 and 8748 for VTA-1 and VTA-2, respectively). The frequencies of parent populations are indicated by circles within the plots, and the target intact nuclei are indicated by the boxed area. i, Table indicating the total number of recorded events for VTA-1 and VTA-2 exemplar FACS gating as shown in Extended Data Fig. 4h, as well as the number and percentage of intact nuclei. j, Distribution of fragment sizes for (sc)ATAC-seq data used in this study. Bulk ATAC-seq data was generated from mES cells. snATAC-seq was generated from midbrain VTA, from which 216 nuclei were classified as DNs (see Methods). OLG and PGN scATAC-seq was collected from published data (see Methods, Supplementary Table 6). k, Aggregated sequencing reads at 2kb genomic regions centered on transcription start sites (TSSs). Nucleosome-free regions (NFRs; < 147 bp) were extracted from the ATAC alignment BAM files in each cell type (i.e. fragments). NFRs are enriched at the TSS for all ATAC-seq datasets. l, Number of fragments per cell/nucleus for sc/snATAC-seq datasets. The number of unique fragments per nucleus was highest for DNs. m, Single-cell accessibility maps for DNs generated in the present study were visualized together by UMAP embedding, and coloured by expression of DN marker genes or marker genes for OLGs and PGNs. Per-cell gene scores were calculated for each DNs marker gene (see Methods). DNs expressed DN-specific markers Pitx3, Foxa2, Lmx1b and Th, while not expressing OLG and PGN markers Olig2 and Camk2a, respectively. n, Top four enriched gene ontologies (GO) for DN marker genes (973 genes; over-representation as measured by Z-Score; see Methods for marker selection), containing terms relevant for dopamine metabolism, synaptic transmission and behaviour. All enriched GOs were highly significantly enriched (one-sided Fisher’s exact permuted p-values = 0).

