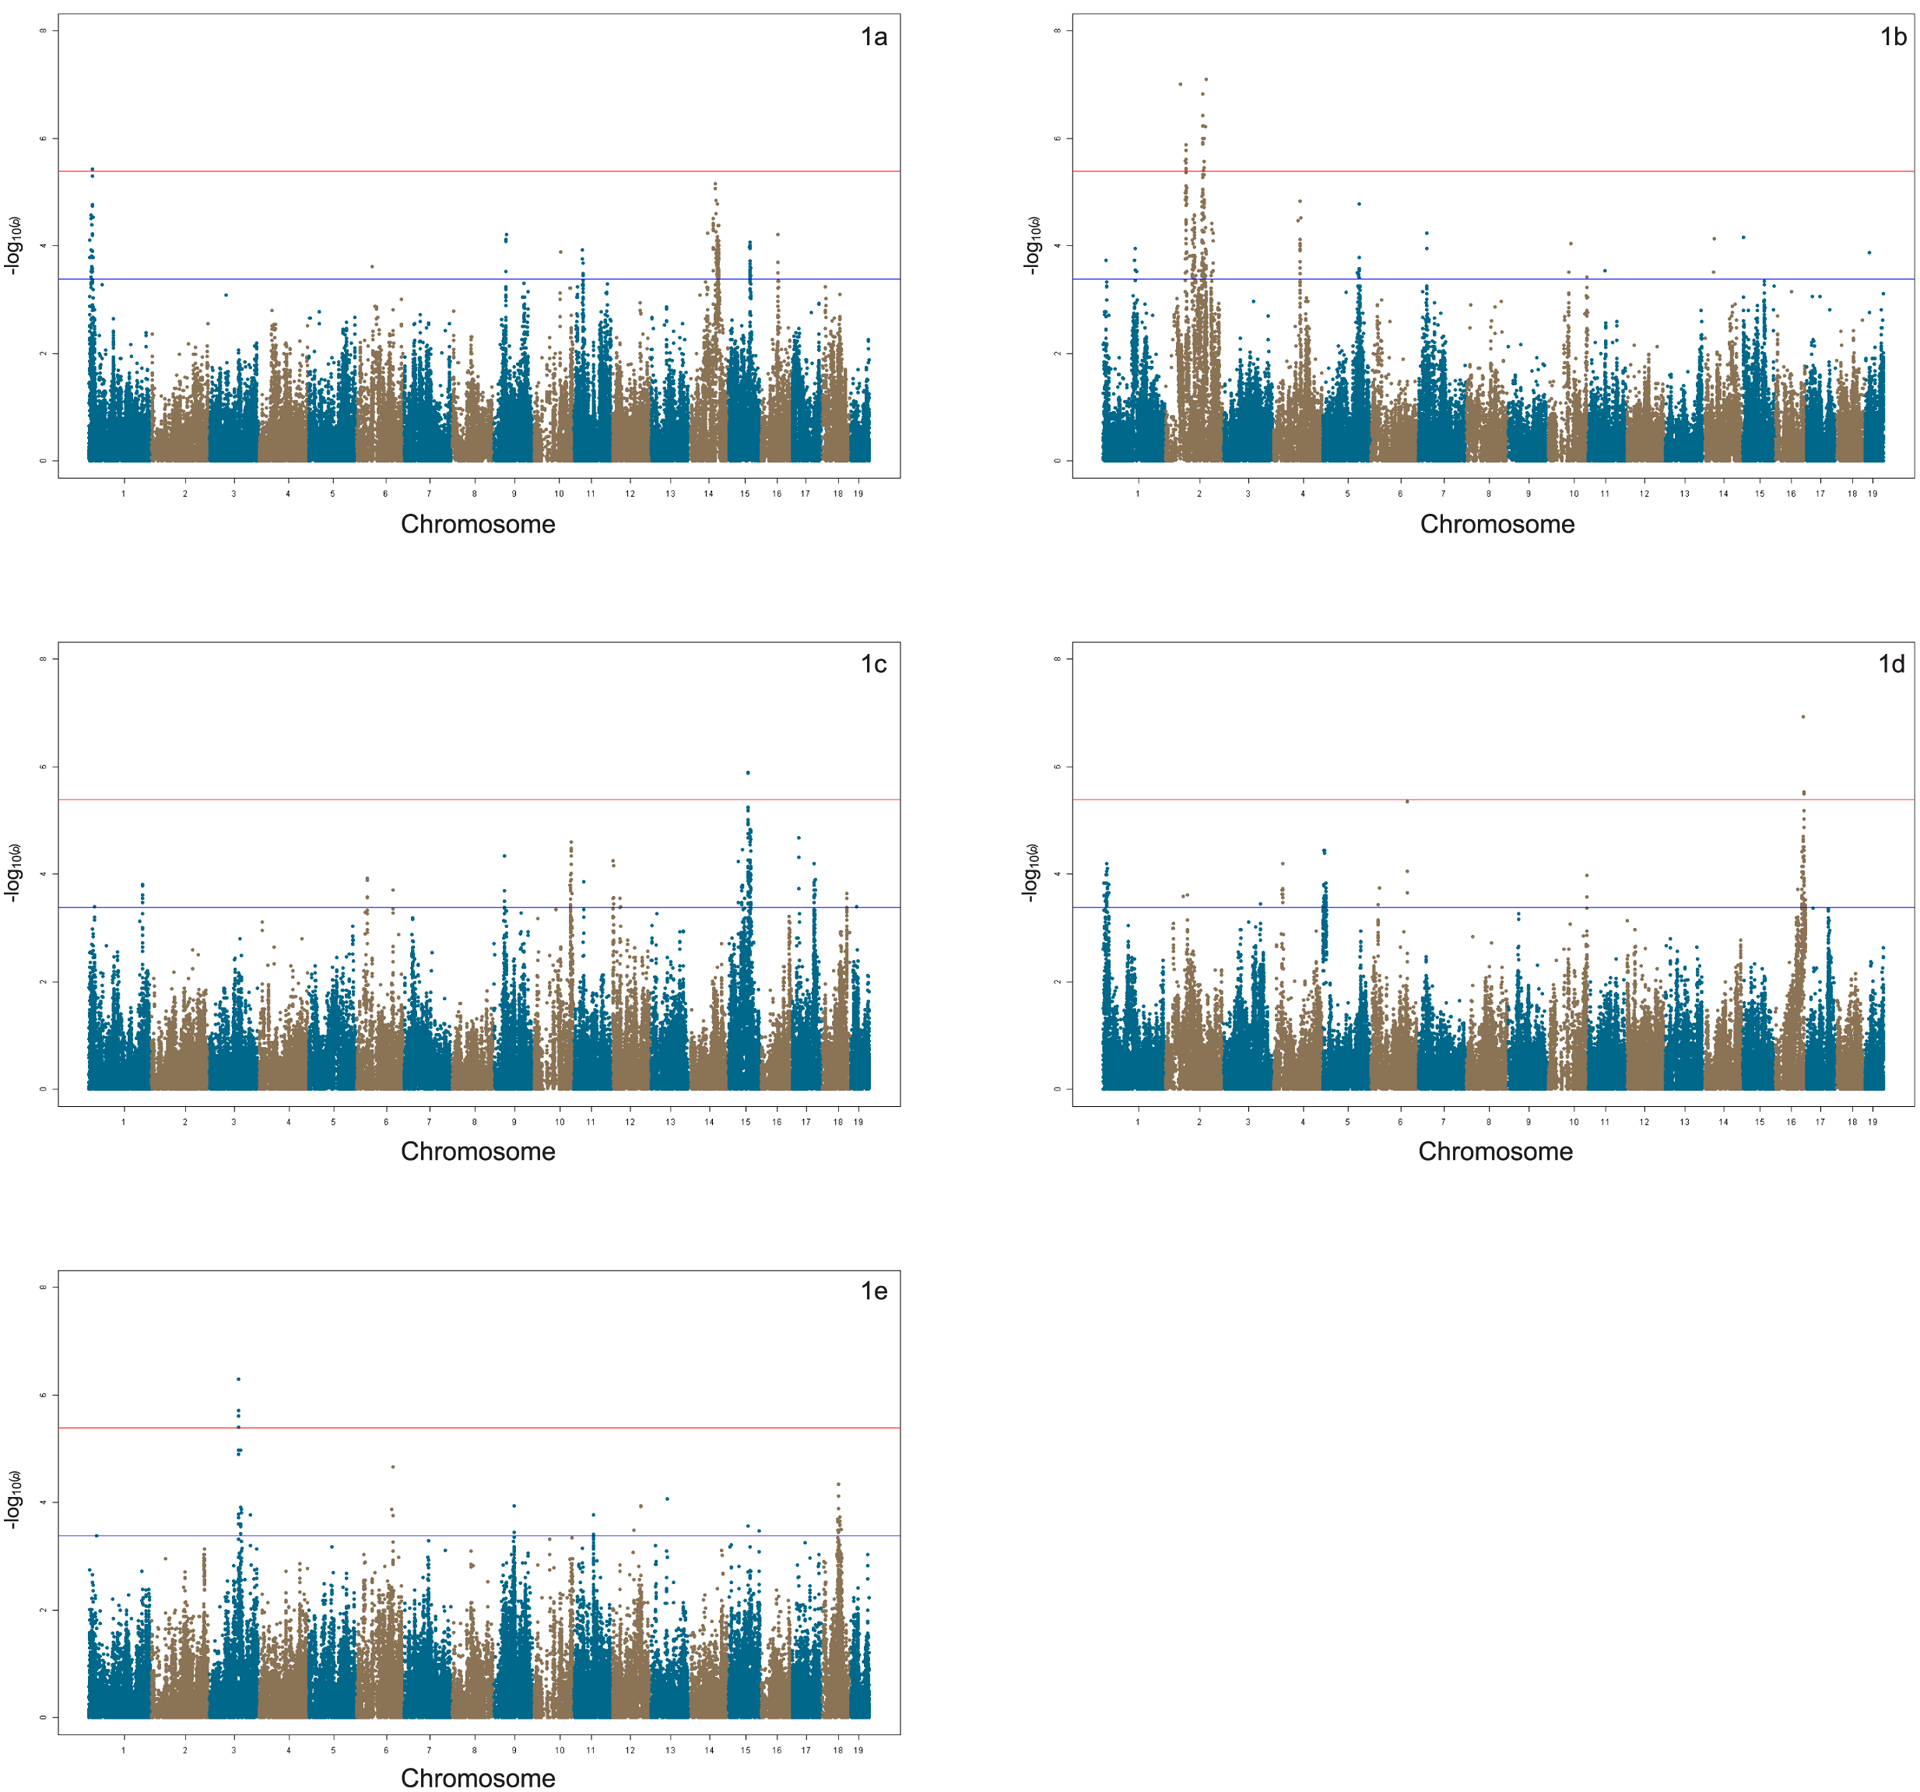
Figure 1. Manhattan Plots: DPOAE GWAS.

Association peaks (−log10) of p-values (−log10p) for 32 kHz - 70 dB (1a) before noise exposure and 8 kHz - 70 dB (1b), 11.3 kHz - 70 dB (1c), 16 kHz - 60 dB (1d), and 32 kHz - 70 dB (1e) after noise exposure (HMDP inbred strains). Analysis was performed using approximately 200,000 SNPs with minor allele frequency > 5%. Each chromosome is plotted on the x-axis in alternating brown and blue colors.
