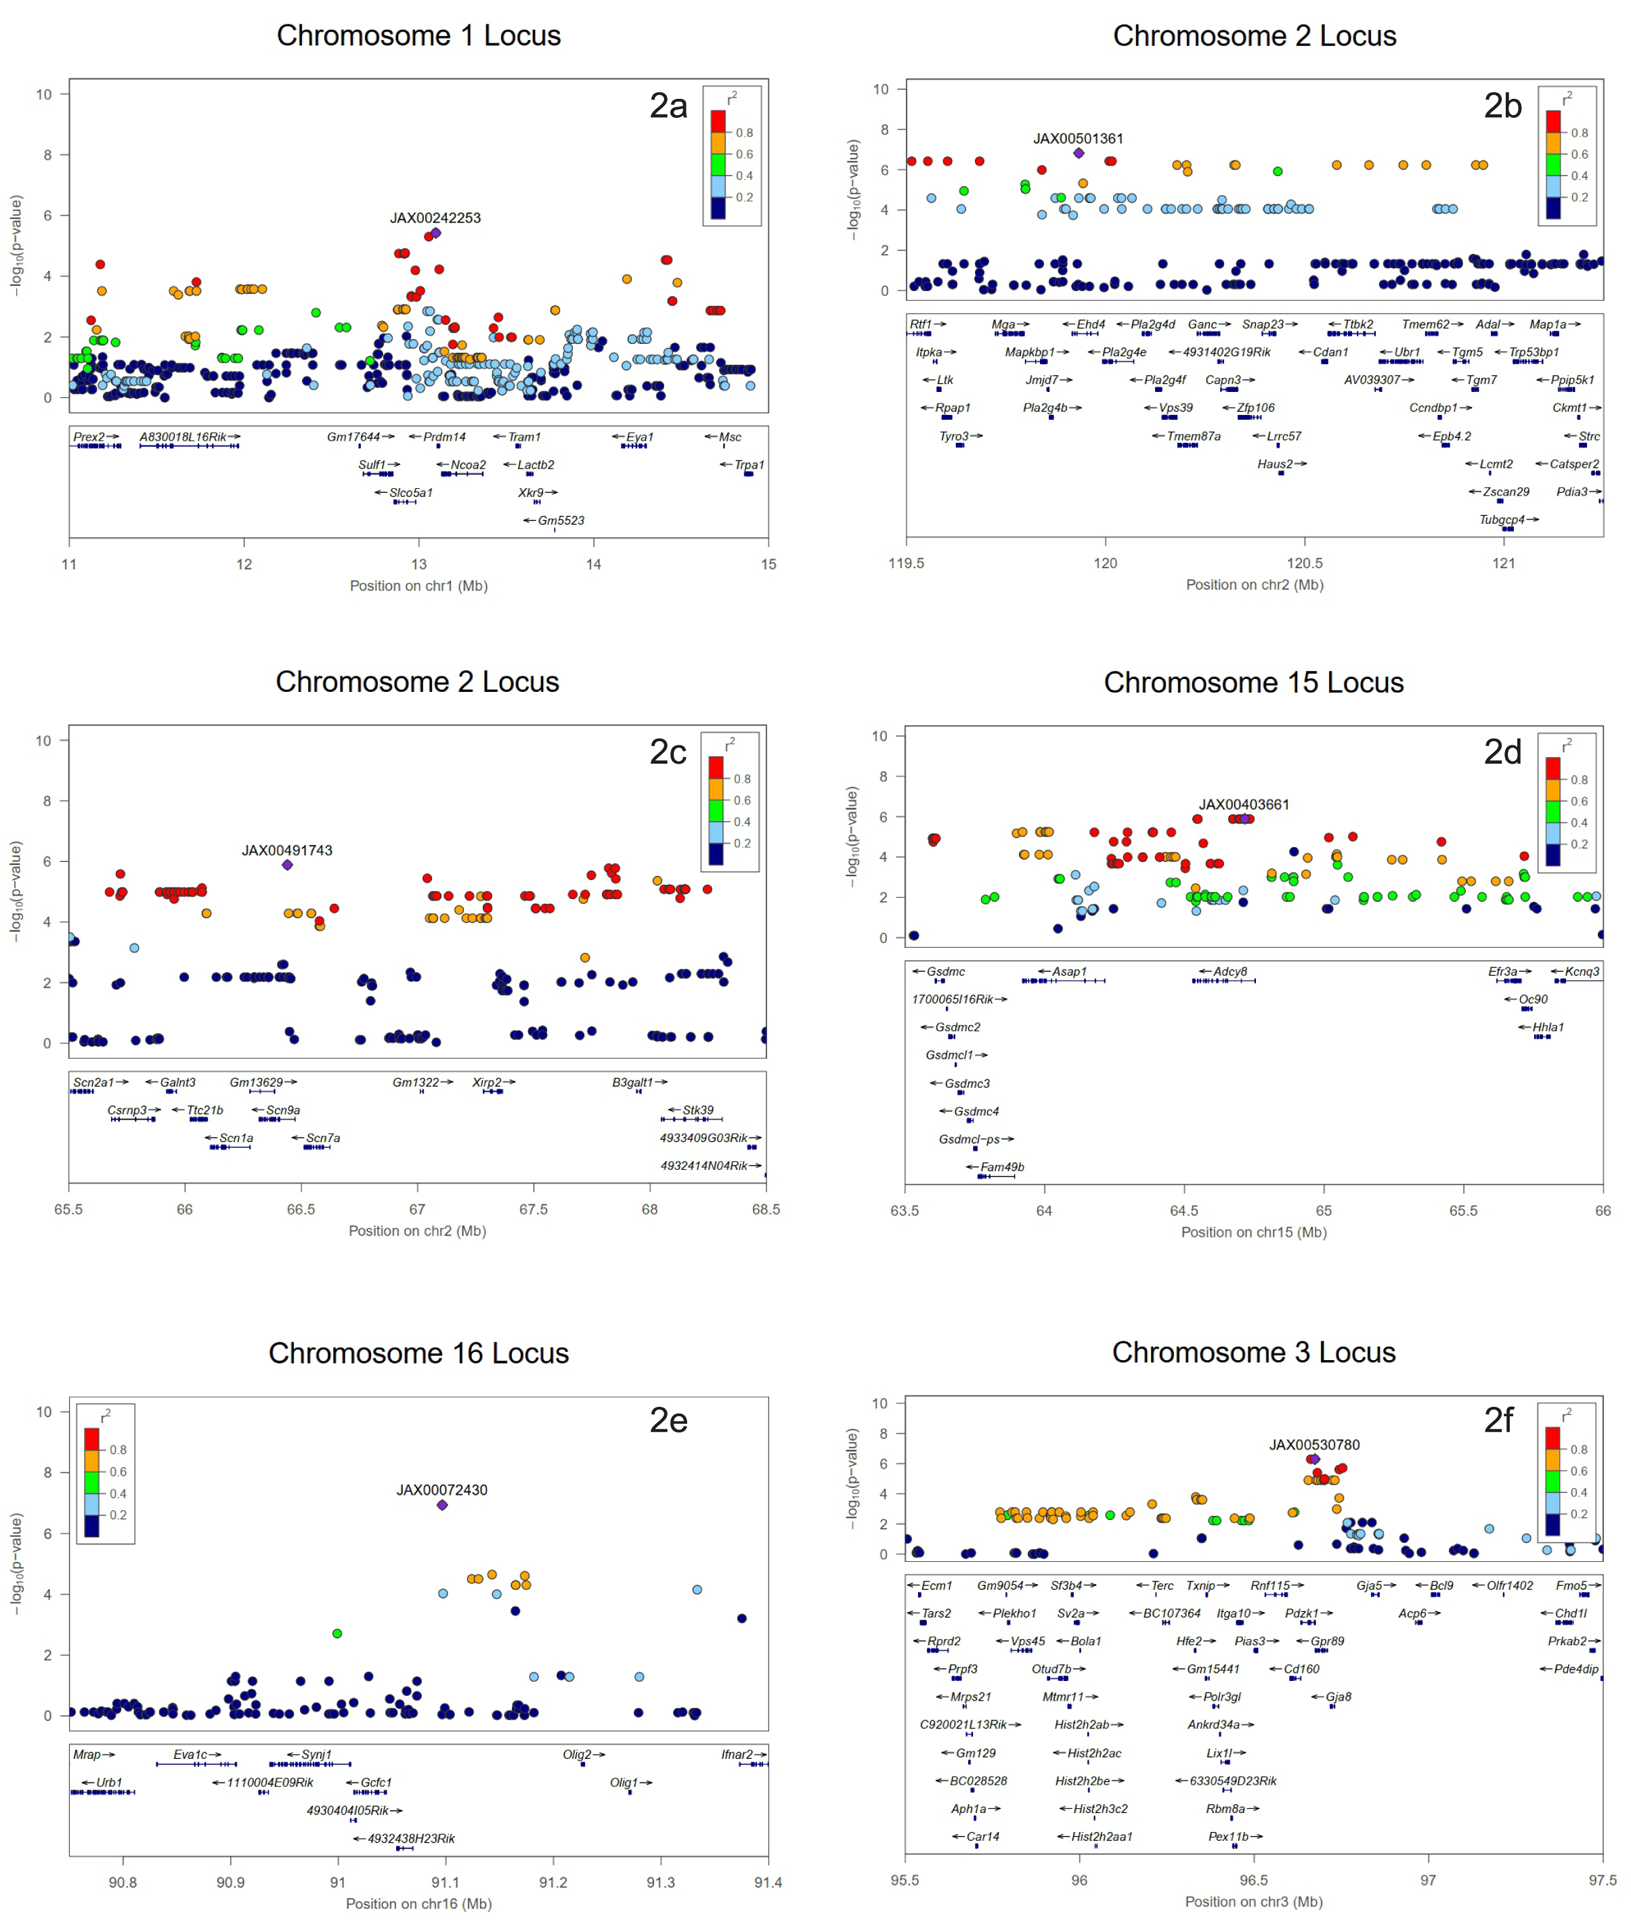
Figure 2.

Association peak centered on the lead SNP for 32 kHz - 70 dB (2a) before noise exposure and 8 kHz - 70 dB (2b and 2c), 11.3 kHz - 70 dB (2d), 16 kHz - 60 dB (2e), and 23 kHz - 70 dB (2f) after noise exposure (HMDP inbred strains). The blue diamond represents the most significant SNP. Other SNPs are colored based on their linkage disequilibrium (LD), as follows: red SNPs in LD at r2 > 0.8, orange SNPs in LD at r2 > 0.6, and green SNPs in LD at r2 > 0.4. The positions of all RefSeq genes are plotted using genomic sites (NCBI Build 37).
