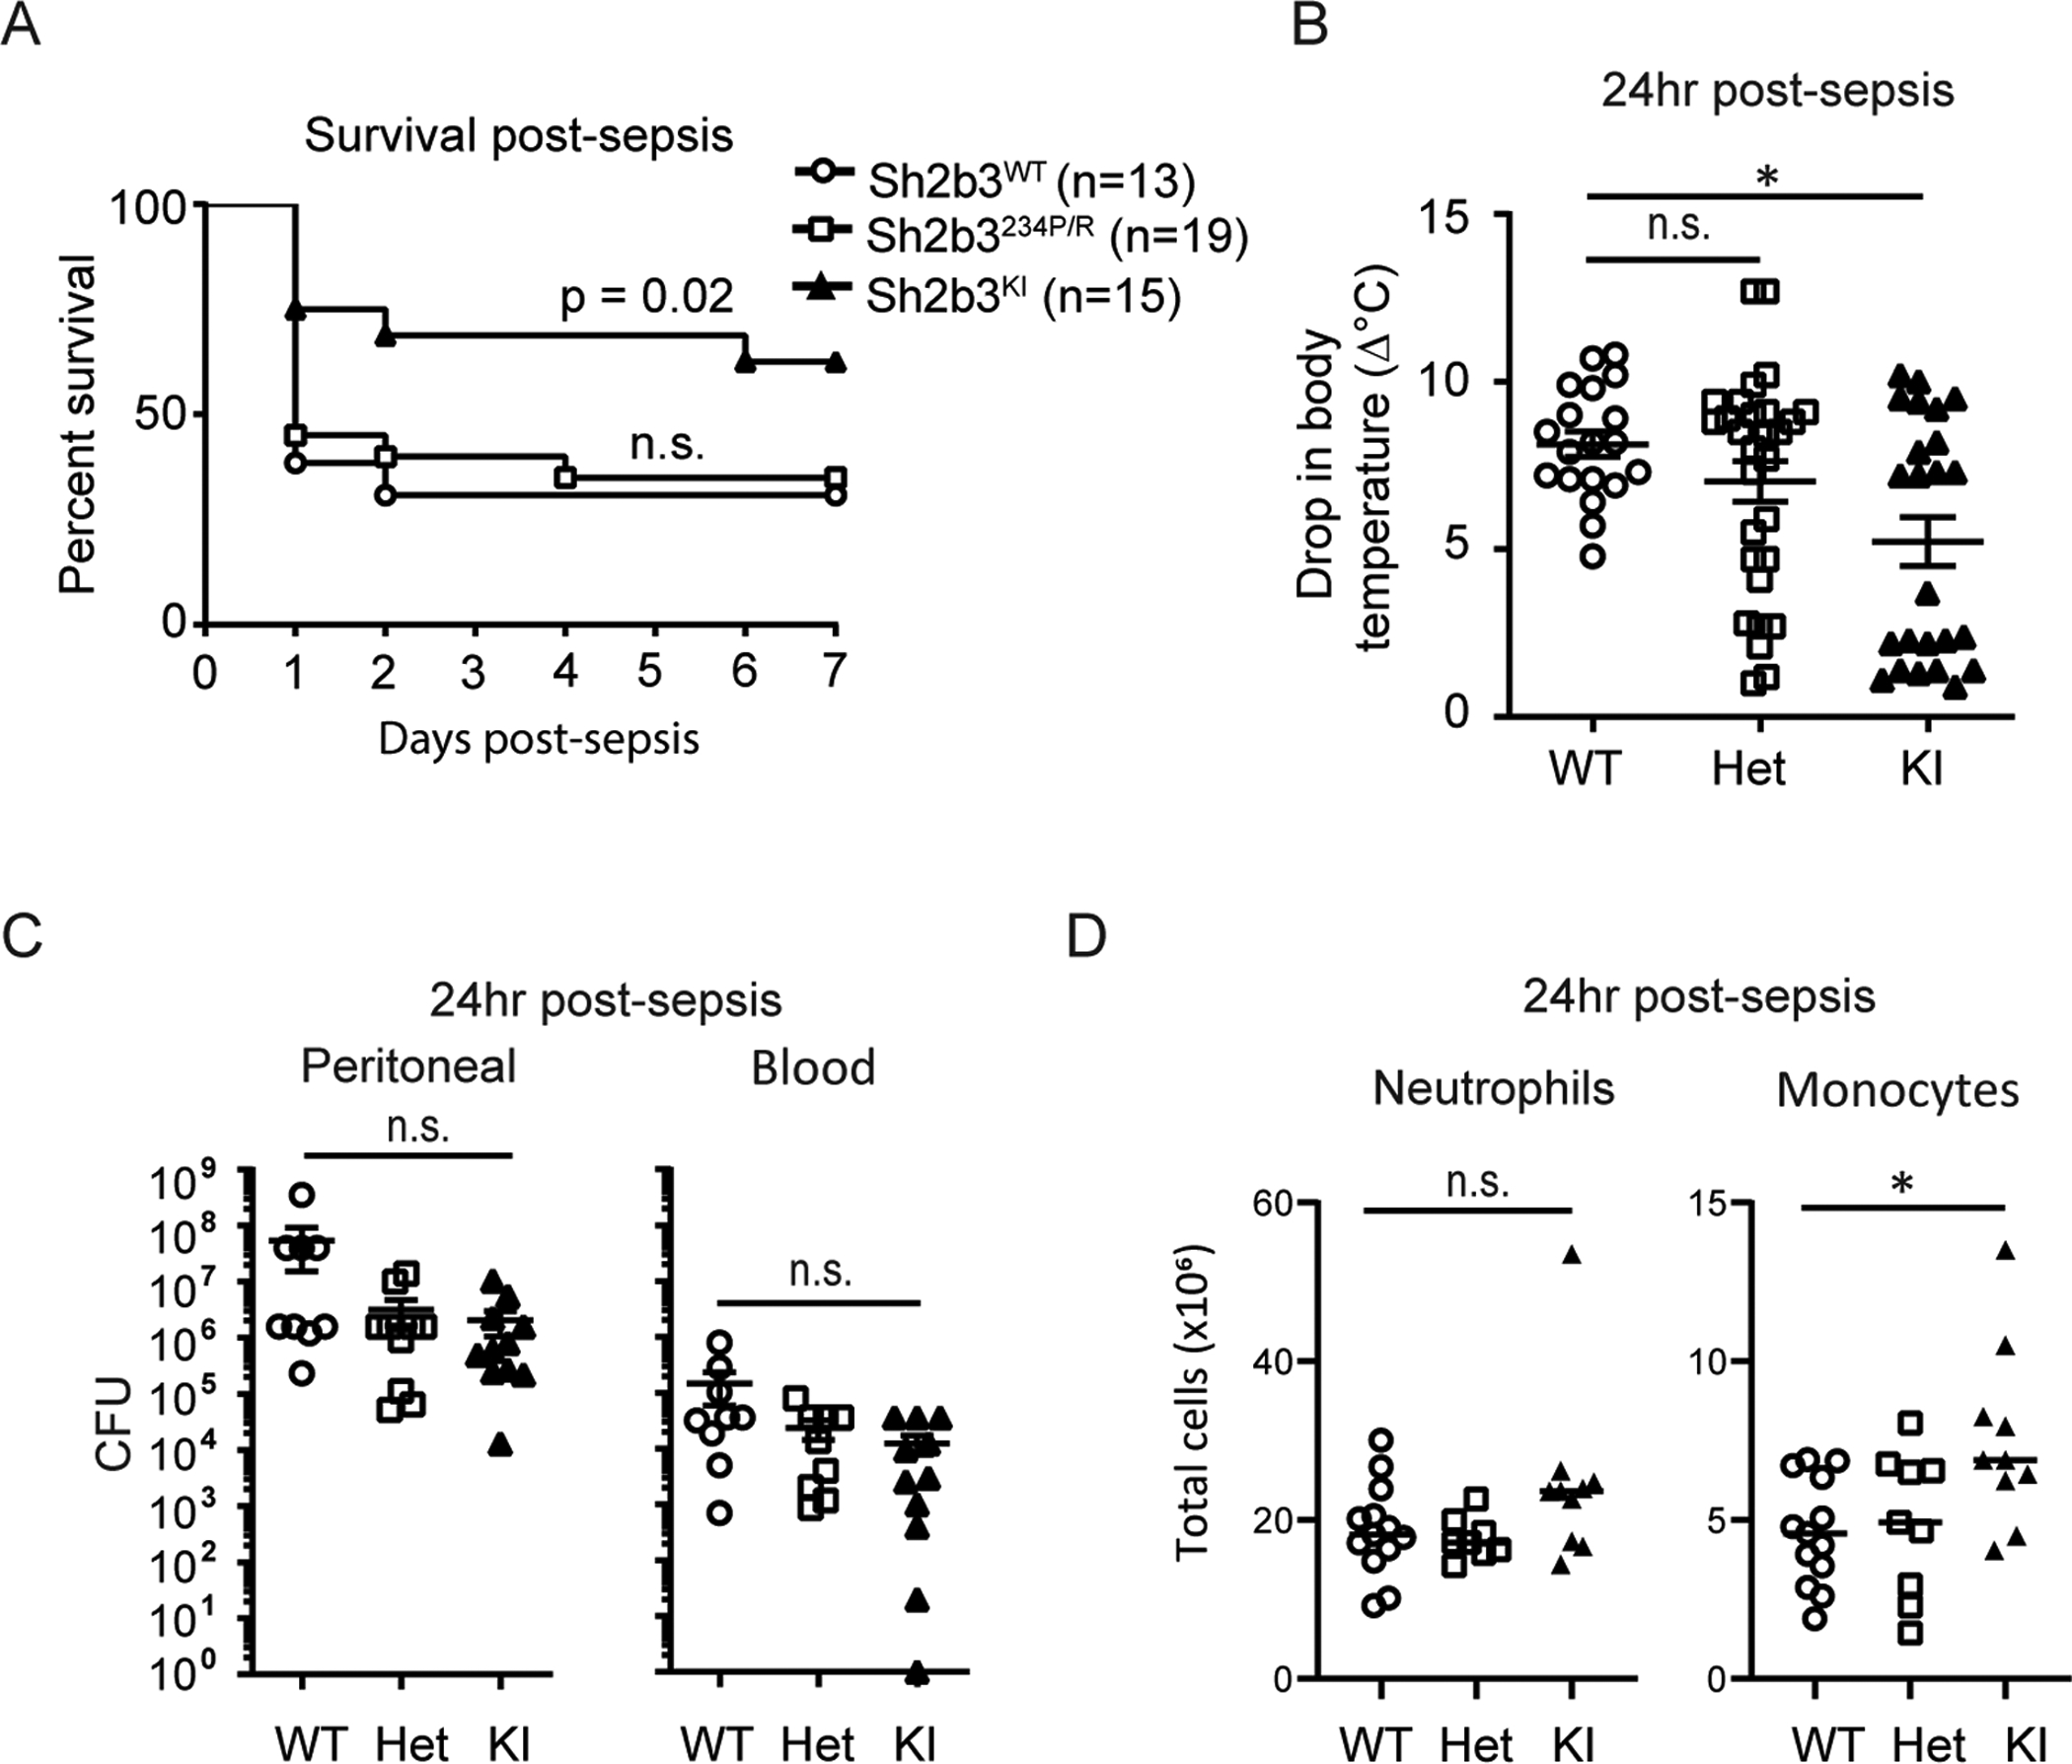
Figure 5. Homozygous Sh2b3 knock-in mice demonstrate improved sepsis response.

Comparison of Sh2b3WT, heterozygote (Sh2b3234P/R), and Sh2b3KI mice using a similar high-grade CLP model. (A) Survival curve in mice over 7 days following CLP (n=13–19/group, WT n=13, HET n=19, KI n=15) analyzed with the Kaplan-Meier test. * WT vs KI (p=0.02) via the Chi square test. (B) Body temperature measured 24-hours post-CLP (n = 18–30/group; WT n=30, HET n=25, KI n=24) (**WT vs KI (p=0.0134). Analyzed via Kruskal-Wallis test; post-hoc analysis by Dunn’s multiple comparisons test. (C) Colony-forming units (CFU) in the peritoneal fluid (left) and blood (right) at 24-hours post-CLP (WT n=11, HET n=9, KI n=13). Statistical analysis by one-way ANOVA. * p<0.05. (D) Comparison of peritoneal myeloid subsets at 24-hours post-CLP. Ex-vivo peritoneal neutrophil (CD11b+Ly6G+Ly6C+) and inflammatory monocytes (CD11b+Ly6G−Ly6C+) were quantified and characterized by flow cytometry (WT n=13; HET n=9; KI n=10). Statistical analysis by one-way ANOVA. * p<0.05. Data are presented as means (±SEM).
