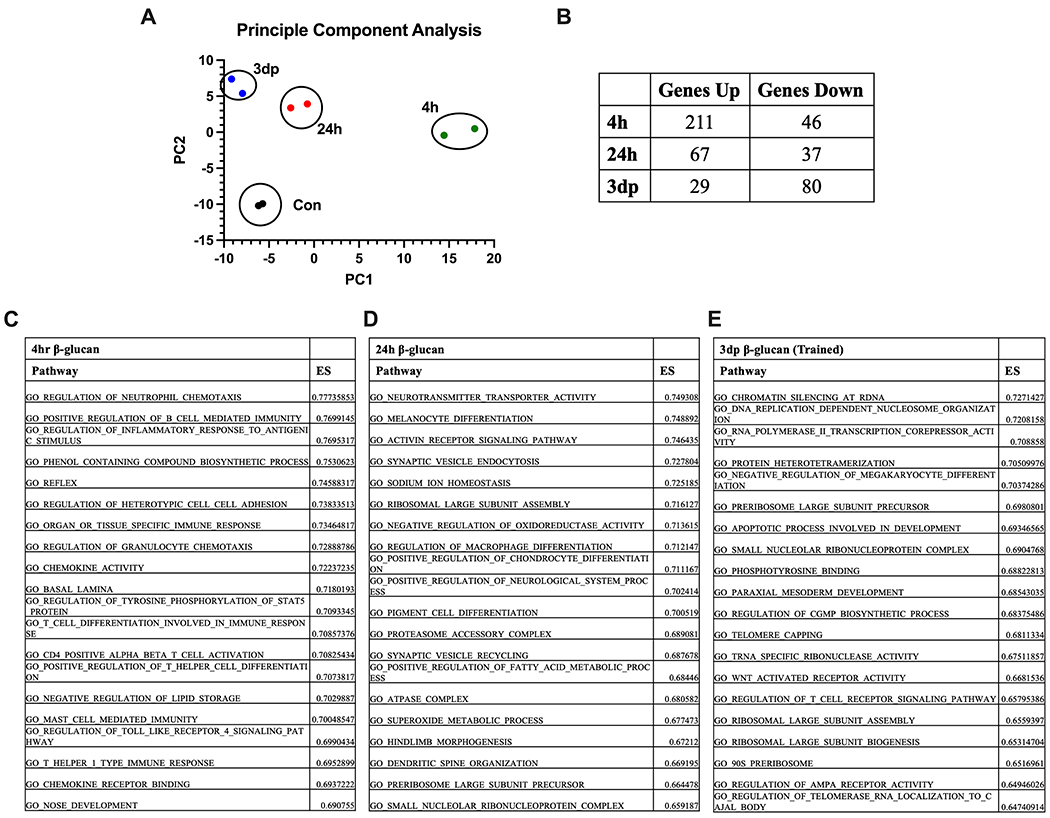
Figure 5. Beta-glucan induces a distinct transcriptomic profile in macrophages.

BMBM were treated with β-glucan (5 μg) or vehicle for 4 (4h) or 24 (24h) hours. A subset of 24h BMDM were washed and allowed to rest for 3 days (3dp). Gene expression was measured using RNAseq. (A) Principal Component Analysis of BMDM harvested at specified time points. (B) Relative gene expression by BMDM treated with β-glucan relative to control at the specified time points. ES = enrichment score (C) Top 20 pathways identified by gene ontology analysis at 4 hours after β-glucan treatment relative to control. (D) Top 20 pathways identified by gene ontology analysis at 24 hours after β-glucan treatment relative to control. (E) Top 20 pathways identified by gene ontology analysis at 3dp after β-glucan treatment relative to control. RNA quantification performed in duplicate.
