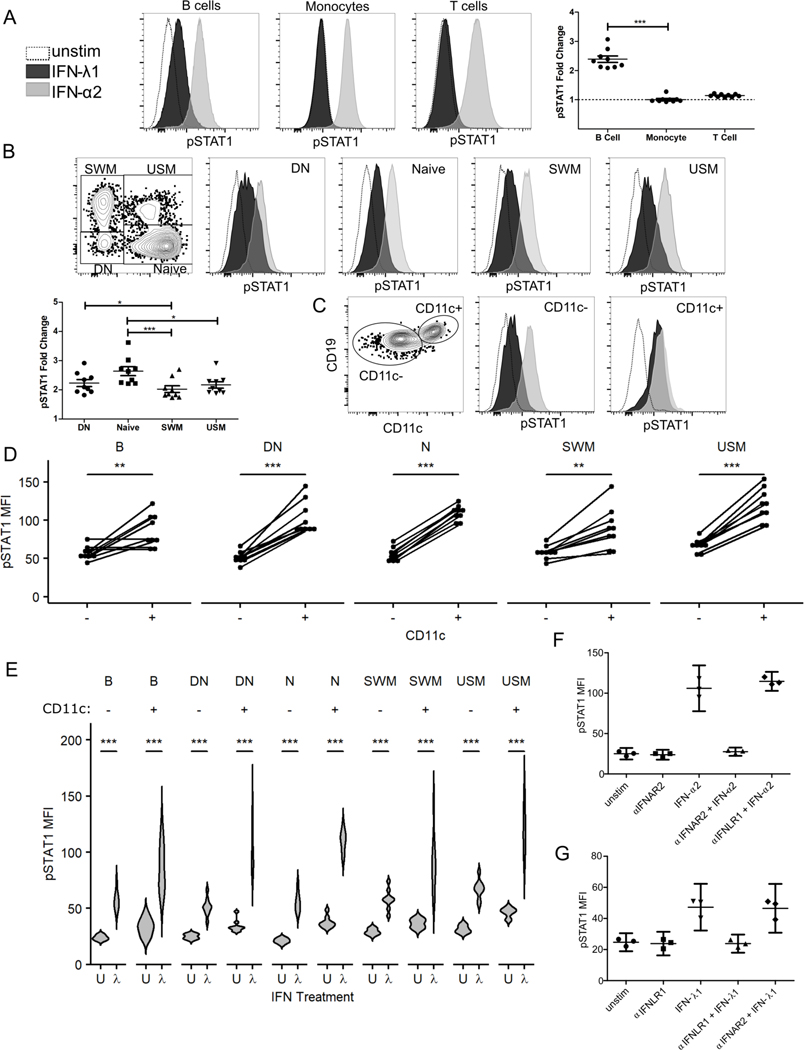
Fig. 5. CD11c+ B cells are hyper-responsive to IFN-λ1 stimulation.
Peripheral blood mononuclear cells were stimulated with IFN-α2 (500U/ml) or IFN-λ1 (2000U/ml) for 25 minutes for detection of phosphorylated STAT1 protein by flow cytometry. Histograms shown pSTAT1 for unstimulated (dashed), IFN-λ1 (black), and IFN-α2 (gray) stimulated cells. A) Fold change of IFN-λ1 stimulated/unstimulated pSTAT1 median fluorescent intensity expression shown for CD14+ monocyte, CD3+ T or CD19+ CD20+ B cells (n=9 HD, mean±SEM). Friedman test with p-values shown from Dunn’s multiple comparison post-test. B) B cell subpopulation gating strategy (left top). Histograms and fold change (bottom left) of IFN-λ1 stimulated/unstimulated for pSTAT1 for each B cell subset (n=9 HD, mean±SEM). Statistics calculated by Friedman test with p-values shown from Dunn’s multiple comparison post-test. C) CD11c+ expression in DN cells from donor with well-defined DN2 population. CD11c+ and CD11c- DN gating strategy and pSTAT1 histograms shown. D) pSTAT1 MFI after IFN-λ1 stimulation for CD11c- and CD11c+ paired data for each B cell subset. Lines represent individual donors with p-values from Wilcoxon Signed Rank Test. E) Violin plots of pSTAT1 MFI for unstimulated (U) and after IFN-λ1 (λ) stimulation for CD11c- and CD11c+ B cell subsets. Statistics calculated as paired, non-parametric two-tailed Wilcoxon Signed Rank Test. * P <0.05, ** P<0.01, *** P<0.001. F & G) IFN receptor neutralization specifically and significantly reduced pSTAT1 phosphorylation induced by IFN stimulation of CD19+ HD B cells. Antibody blockade of type I IFN receptor (IFNAR2) reduced pSTAT1 MFI after IFN-α2 stimulation which was unaffected by type III IFN receptor (IFNLR1) blockade (n=3, F). Similarly, IFN-λ1 induced STAT1 phosphorylation was inhibited with anti-IFNLR1 but not by type I IFN receptor blockade with anti-IFNAR2 (n=3, G). Mean± 95% confidence interval shown (F & G).

