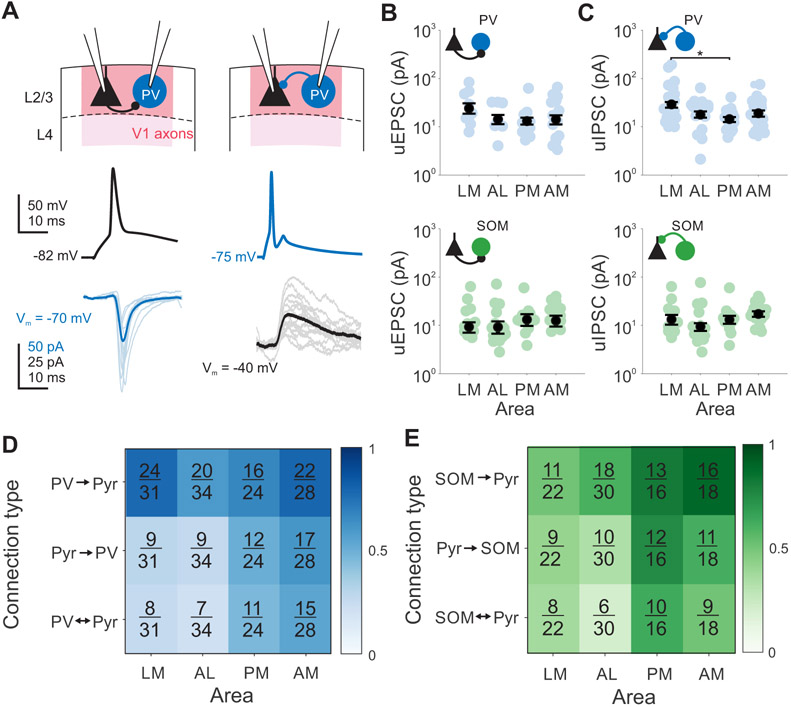
Figure 7. Higher recurrent connectivity between pyramidal cells and interneurons in medial HVAs.
A. Example PV (blue) and Pyr (black) pair with both Pyr→IN connection (left) and IN→Pyr connection (right). Thin lines are individual trials, thick lines are mean. B. Amplitude of monosynaptic connections for Pyr→PV inputs (top) or Pyr→SOM inputs (bottom). Colored circles- individual pairs; black circles- average across pairs. Error is SEM across pairs. *, **, and *** denote p < 0.05, 0.01, and 0.001. C. Same as B, for IN→Pyr connections. D. Fraction of connections found out of total connections tested for PV/Pyr pairs, sorted by area and connection type. Shading of box indicates connection probability. See also Table S2. E. Same as D, for SOM/Pyr pairs.

