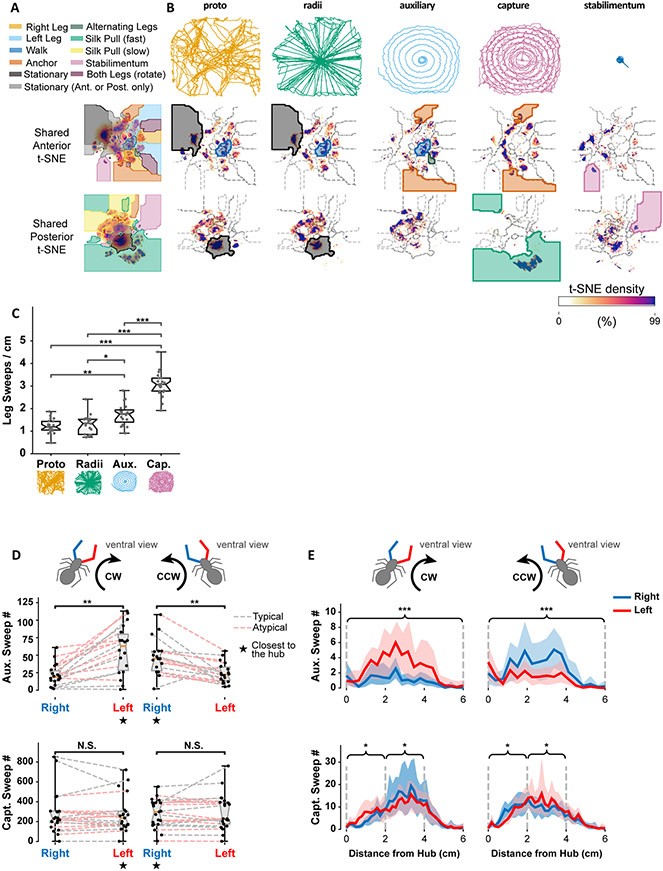
Figure 4. Stages of web-building use both shared and stage-specific motifs.
A. Top: Legend of anterior and posterior movement motifs. Bottom: Cluster boundaries for each movement in the anterior and posterior embeddings.
B. Top: Example centroid paths of a spider during different web stages. Middle: Anterior t-SNE embeddings for different web stages, averaged across all 21 recordings, and clipped at the 99th percentile to show structure. Shading used in A indicate motifs of note in the text. Bottom: Same as Middle, but for Posterior t-SNE embeddings.
C. Spatial density of leg sweep occurrences by stage of web-construction. Notches represent the 95% confidence interval of the median. P-values based on Bonferroni-corrected two-sided Mann-Whitney rank tests (*: p < 0.05, **: p < 0.01, ***: p < 0.001).
D. Left and right leg sweep occurrences during the auxiliary spiral (top) and capture spiral (bottom), for atypical (red) and typical (grey) recordings. CW: Clockwise, CCW: Counter-clockwise. Notches represent the 95% confidence interval of the median. P-values were computed using the Wilcoxon rank test (**: p < 0.01, N.S.: not significant).
E. Left leg (red line) and right leg (blue line) sweep occurrences during the auxiliary spiral (top) and capture spiral (bottom) stages as a function of distance from the hub. Shaded regions represent the bootstrapped 99% confidence interval of the mean. P-values are computed using a Wilcoxon rank test by first pooling occurrences as indicated by the braces (*: p < 0.05, ***: p < 0.001). P-values for capture spiral comparisons were Holm–Bonferroni adjusted. Note that we repeated this analysis for un-pooled histogram bins with qualitatively similar results.

