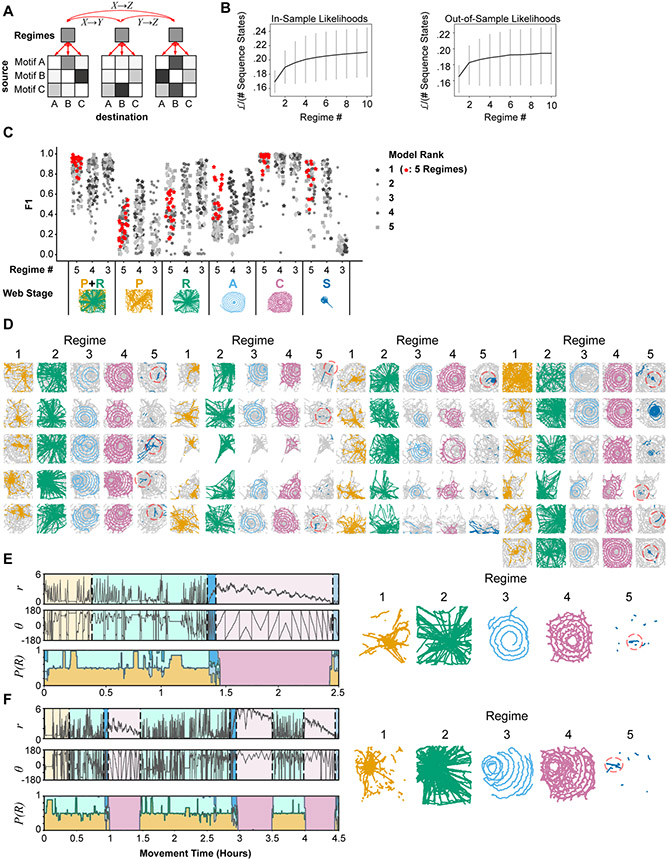
Figure 6. Stereotyped and distinct action sequences characterize stages of web-building.
A. HHMM design. Within each parent state (regime), transitions are modeled as simple Markov processes characterized by a movement motif transition matrix (child states). Transitions between regimes (AX → BY, etc.) by design can only occur through parent nodes, (i.e. AX → X → Y → BY) creating a hierarchical structure.
B. Likelihood for in-sample (left) or out-sample (right) HHMMs for different regime numbers. Gray vertical lines represent the standard deviation of model likelihoods.
C. F1 scores for the top 5 models for each regime-number limit. The top-ranked 5-regime model is highlighted in red, and used for D-F. Model accuracy (F1 score) defined as the agreement between manual stage annotations and stage boundaries predicted by each HHMM. F1 scores were defined based on the optimal mapping of HHMM predicted regimes to manual regimes. For models with fewer than 5 regimes, some predicted regimes were assigned to multiple web stages. The F1 score for the combined proto/radii stage was computed by first merging proto-web and radii annotations for both predicted and manual regimes.
D. Spider positions for all regime occupations and webs for the 5-regime HHMM highlighted in red in (C). Spider positions were assigned to a regime based on the most likely regime designation for that time-point. Dashed red circles indicate stabilimenta.
E. Web-stage manually predicted by spider position versus regime state (bottom panel) predicted by the 5-regime HHMM highlighted in red in (C) for a typical web progression. P(R) is the probability of each regime state. Centroid trajectories corresponding to the maximum-likelihood regime estimate are displayed (right panels), with colors matching the bottom panel.
F. Same as (E), but for an atypical web progression.
See also Figure S6.

