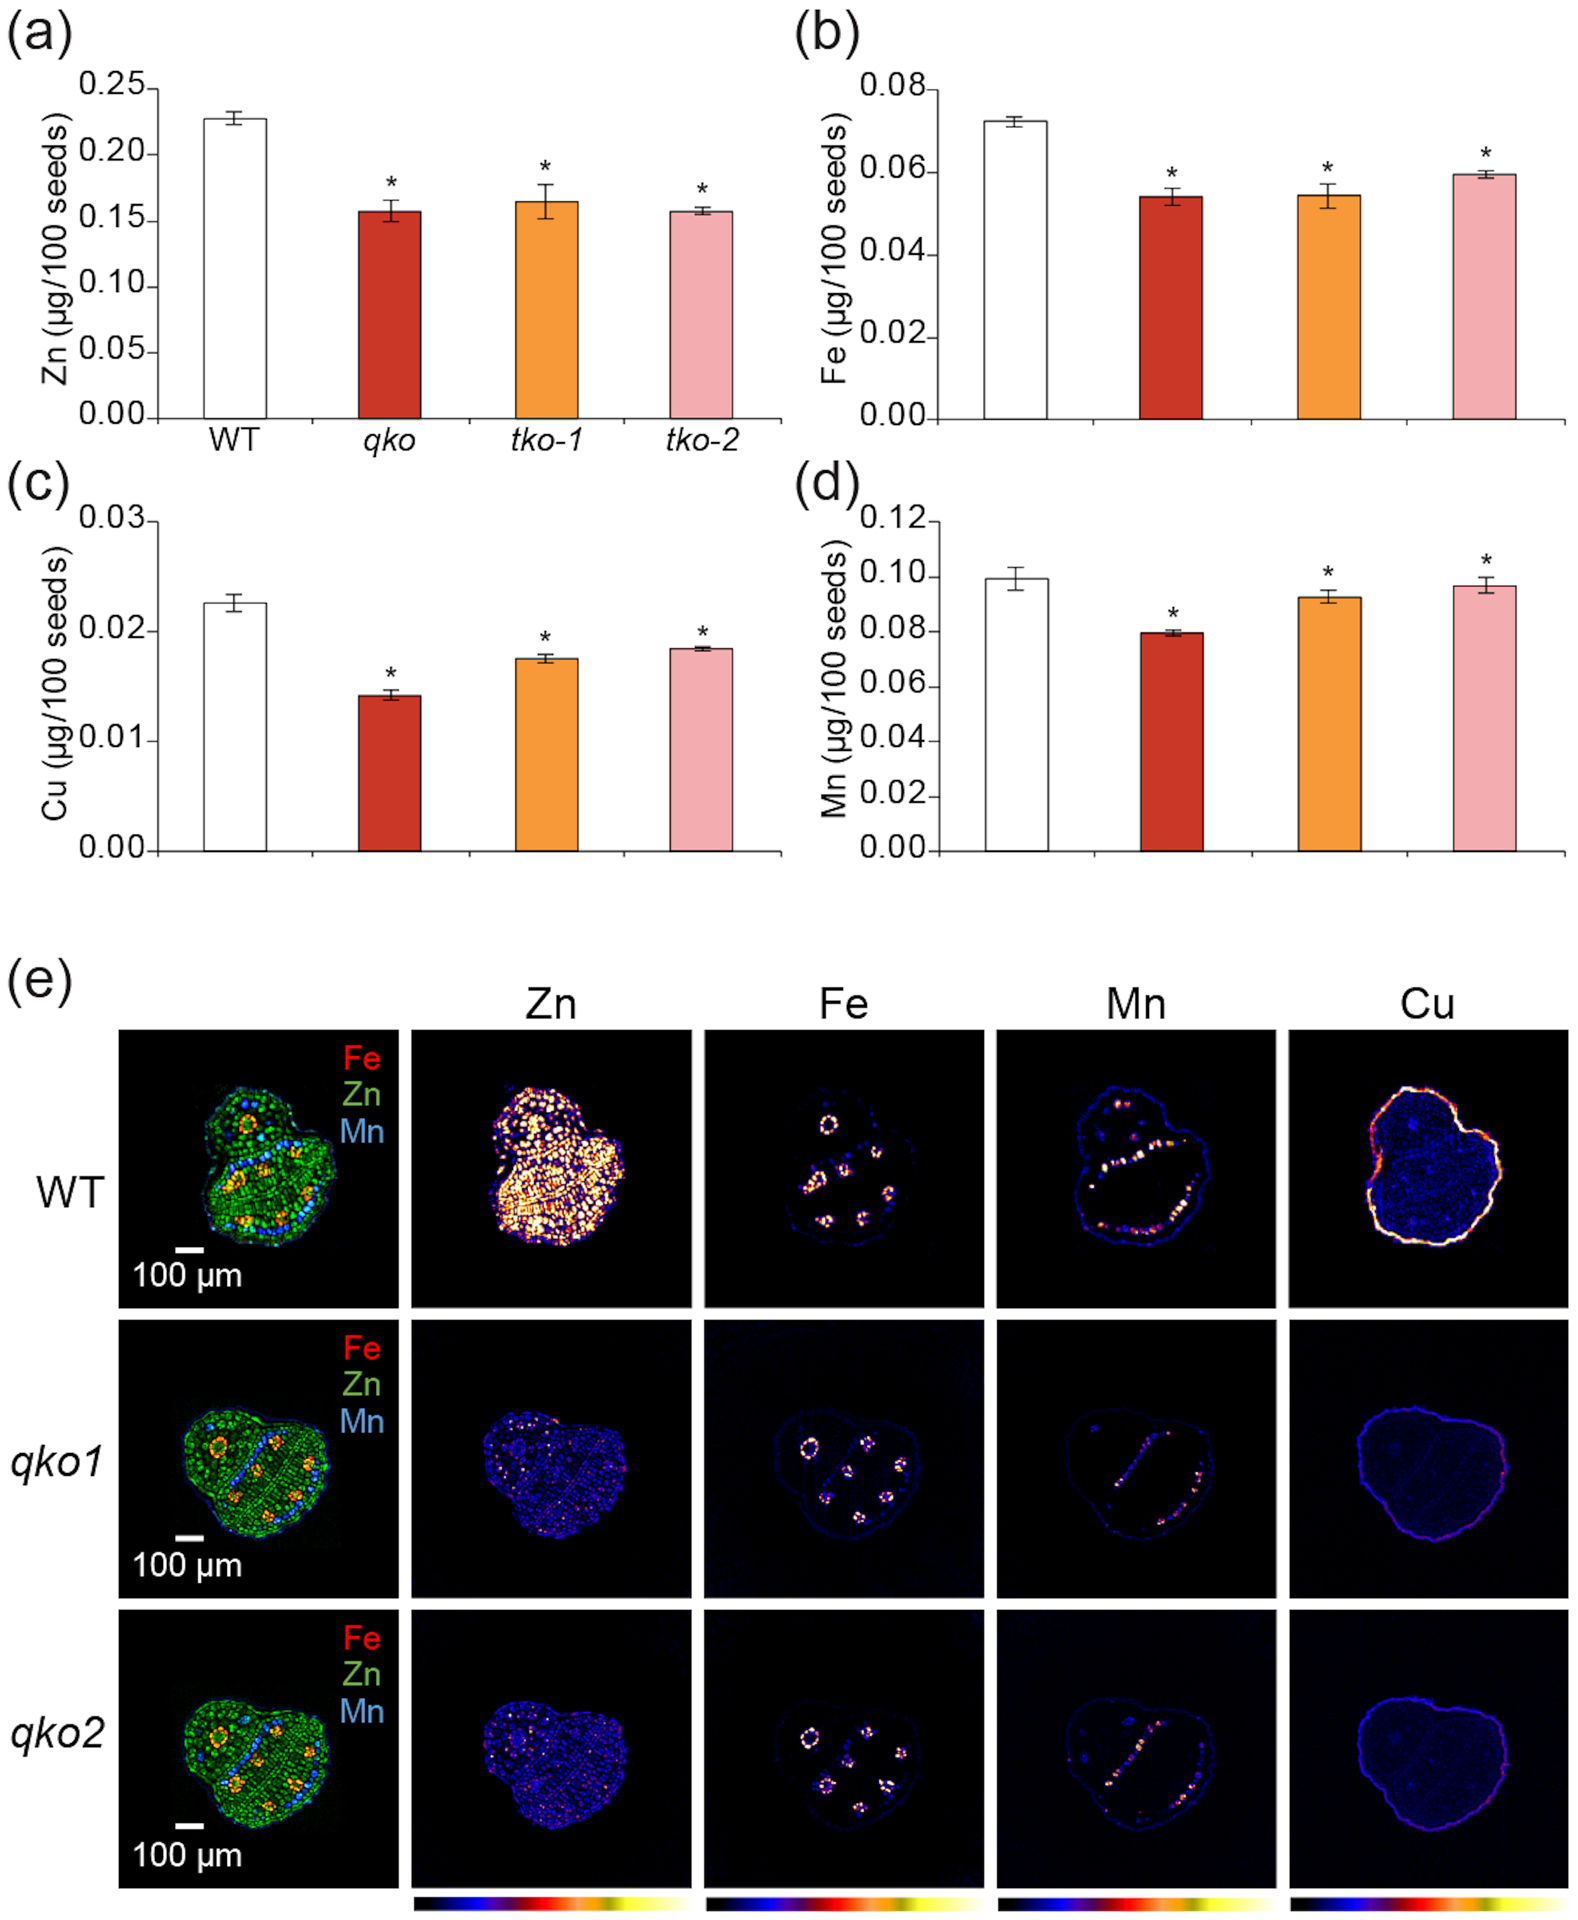
Figure 5.

Metal content in mutant seeds measured by ICP-MS and Synchrotron X-ray fluorescence (SXRF) tomograms of mutant seeds. Quantification of Zn (a), Fe (b), Mn (c) and Cu (d) from WT, quadruple mutant and two triple mutants. Values are mean ± SE of 100 seeds from four independent plants. Asterisks above the bars indicate significant differences between mutant lines and WT (P < 0.05). (e) SXRF microtomography of Arabidopsis seeds. (Left row) SXRF composite images of Fe, Zn, and Mn internal distributions in WT (top) and qko (middle, bottom) seeds. (Right) Intensity-normalized SXRF tomographic slices of Zn Kα, Fe Kα, Mn Kα and Cu Kα fluorescence for WT and qko seeds. Tomograms for each element are scaled to the highest maximum pixel abundance. On the color bar, cooler colors indicate lower abundance and warmer colors higher abundance. qko1 and qko2 are two different seeds.
