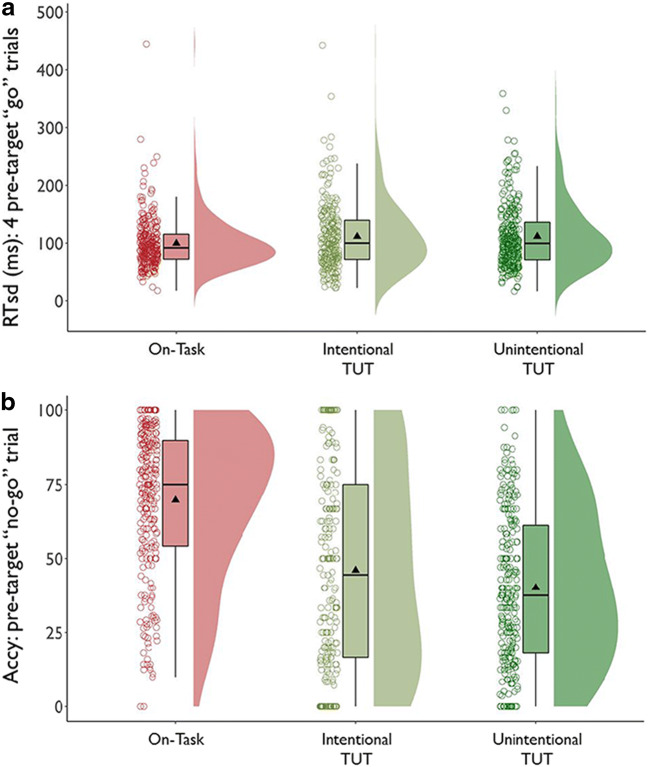
Fig. 10.
a Standard deviations in reaction times (RTsd) for the four go-trials preceding on-task reports, intentional task-unrelated thought (TUT) reports, and unintentional TUT reports in the Sustained Attention to Response Task, for subjects in the intentionality (“Why”) probe condition. Box plots present the 25th, 50th, and 75% percentiles; whiskers extend to the smallest and largest values within 1.5 times the inter-quartile range. Means are presented as triangles. Each dot represents an individual subject’s RTsd preceding on-task, intentional TUT, or unintentional TUT reports. b Accuracy (“Accy”) rates for no-go trials preceding on-task reports, intentional task-unrelated thought (TUT) reports, and unintentional TUT reports in the Sustained Attention to Response Task, for subjects in the intentionality (“Why”) probe condition. Box plots present the 25th, 50th, and 75% percentiles; whiskers extend to the smallest and largest values within 1.5 times the inter-quartile range. Means are presented as triangles. Each dot represents an individual subject’s accuracy rate preceding on-task, intentional TUT, or unintentional TUT reports

