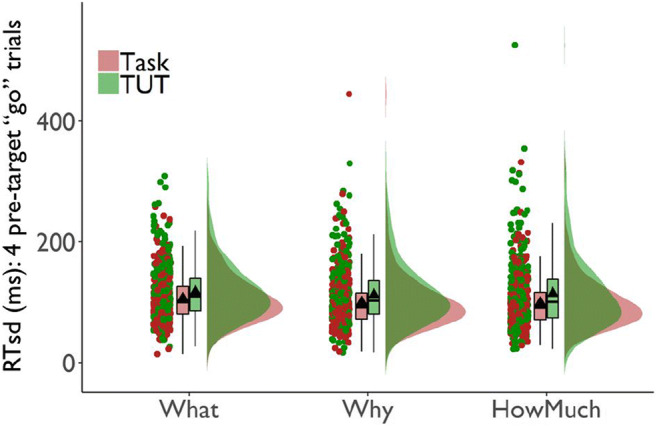
Fig. 4.

Standard deviations in reaction times (RTsd) for the four go-trials preceding task-unrelated thought (TUT) reports versus on-task (Task) reports in the SART, for subjects in the content (“What”), intentionality (“Why”), and depth (“HowMuch”) probe conditions. Box plots present the 25th, 50th, and 75% percentiles; whiskers extend to the smallest and largest values within 1.5 times the inter-quartile range. Means are presented as triangles. Each dot represents an individual subject’s RTsd preceding TUT or on-task reports
