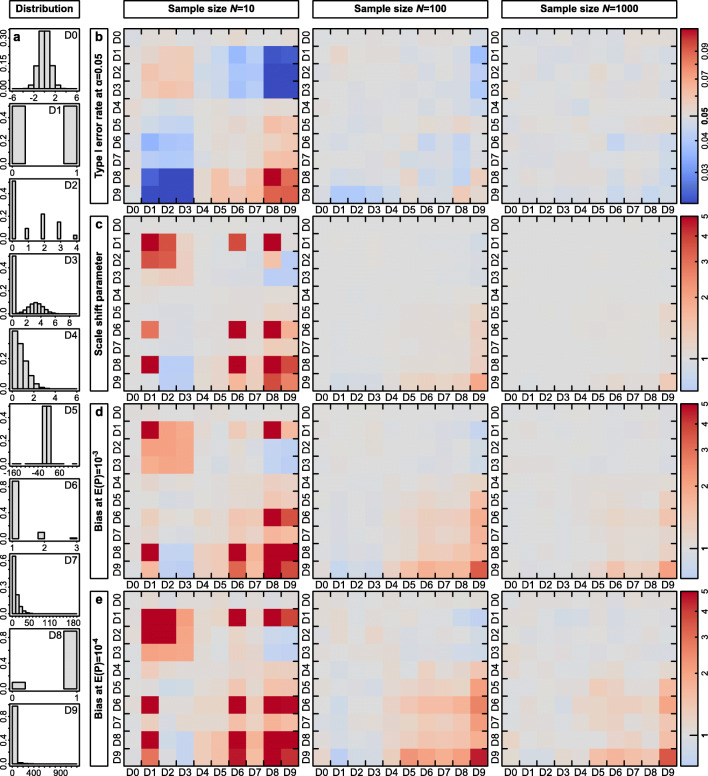
Fig. 1.
p values from Gaussian linear regression models are in most cases unbiased. a Overview of the ten different distributions that we simulated. Distributions D0 is Gaussian and all remaining distributions are sorted by their tendency to produce strong outliers. Distributions D1, D2, D6, D7, and D8 are discrete. The numbers D0–D9 refer to the plots in b–e where on the Y-axis the distribution of the dependent variable and on the X-axis of the predictor is indicated. b Type I error rate at an α-level of 0.05 for sample sizes of N = 10, 100, and 1000. Red colors represent increased and blue conservative type I error rates. c Scale shift parameter, d bias in p values at an expected p value of 10-3 and e bias in p values at an expected p value of 10-4

