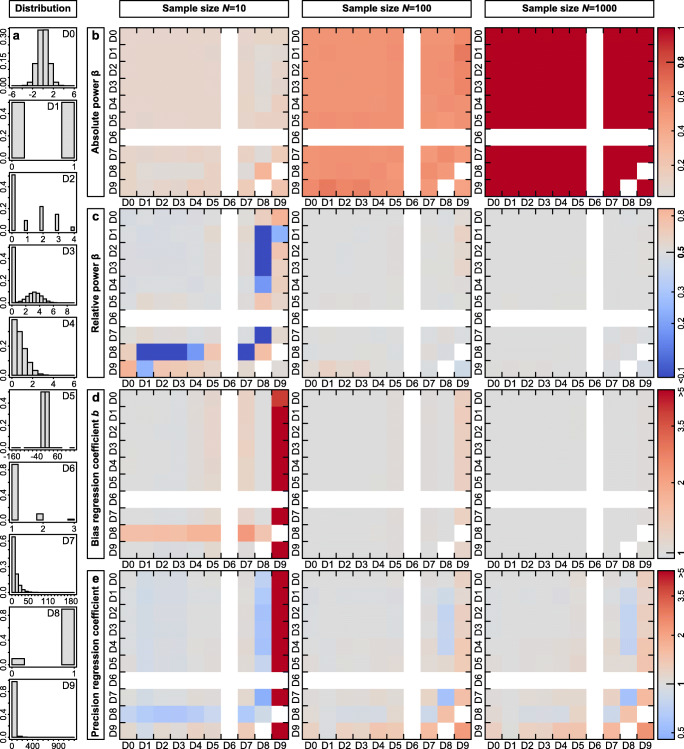
Fig. 2.
Power, bias, and precision of parameter estimates from Gaussian linear regression models are in most cases unaffected by the distributions of the dependent variable Y or the predictor X. a Overview of the different distributions that we simulated, which were the same as in Fig. 1. The numbers D0–D9 refer to the plots in b–e where on the Y-axis the distribution of the dependent variable and on the X-axis of the predictor is indicated. b Power at a regression coefficient b = 0.2 for sample sizes of N = 10, 100, and 1000. Red colors represent increased power. c Power at regression coefficients b = 0.59, 0.19, and 0.06 for sample sizes of N = 10, 100, and 1000, respectively, where the expected power derived from a normally distributed Y and X is 0.5. Red colors represent increased and blue colors decreased power. d Bias and e precision of the regression coefficient estimates at an expected b = 0.2 for sample sizes of N = 10, 100, and 1000

