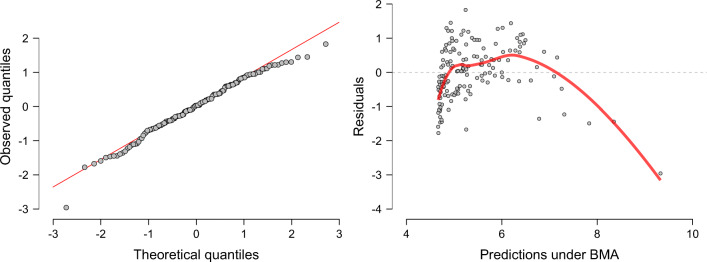
Fig. 2.
Assumptions checks for a linear regression where Happiness is predicted from Wealth, measured in terms of GDP. The left panel shows a Q-Q plot of the theoretical quantiles expected under a normal distribution (x-axis) against the quantiles of the observed residuals obtained from Bayesian Model Averaging (BMA; y-axis). The residuals appear approximately normally distributed. The right panel plots the predictions under BMA (x-axis) against the residuals (y-axis). Figures from JASP

