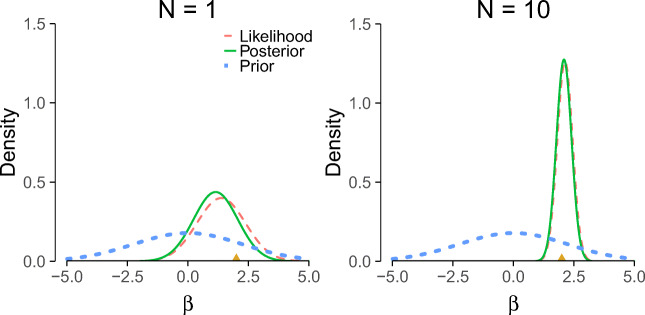
Fig. 3.
Illustration of Bayesian updating using Bayes’ theorem for a single observation (left panel) and ten observations (right panel). The ‘true’ value is 2 and is indicated by the gold triangle on the x-axes. Note that (1) the posterior depends less on the prior as more data are observed; (2) the variance (width) of the posterior decreases with sample size. In other words, we become more certain of our estimates as we observe more data. In the right panel, the likelihood was normalized for illustrative purposes. This example is based on normally distributed data with unknown mean and known variance (for derivations, see Murphy, 2007)

