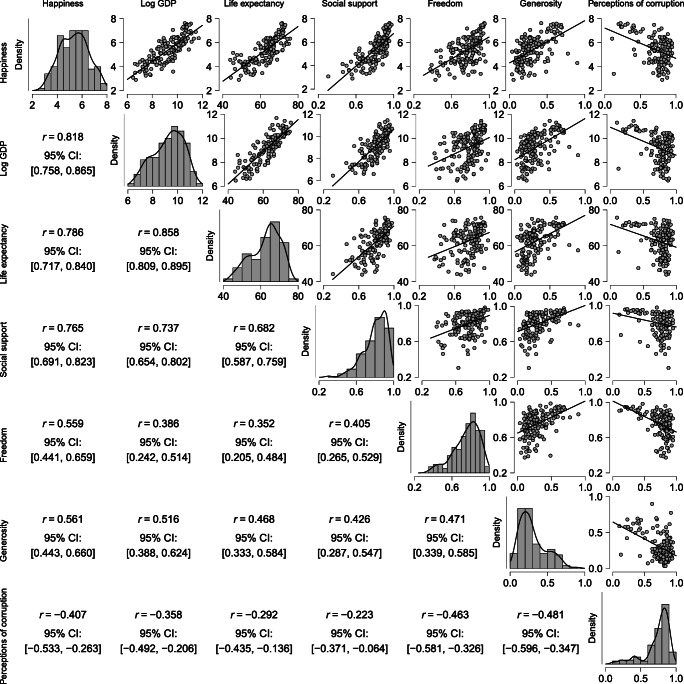
Fig. 4.
A matrix-plot of all variables in the World Happiness Data. The diagonal plots are the density estimates of the individual variables. The above-diagonal plots are pairwise scatter plots of two variables, where the straight line represent the correlation between them. In the first row, Happiness score (y-axes) is plotted against all independent variables (x-axes). Below the diagonal the Pearson correlations are displayed. All relations appear approximately linear by eye. Figure from JASP

