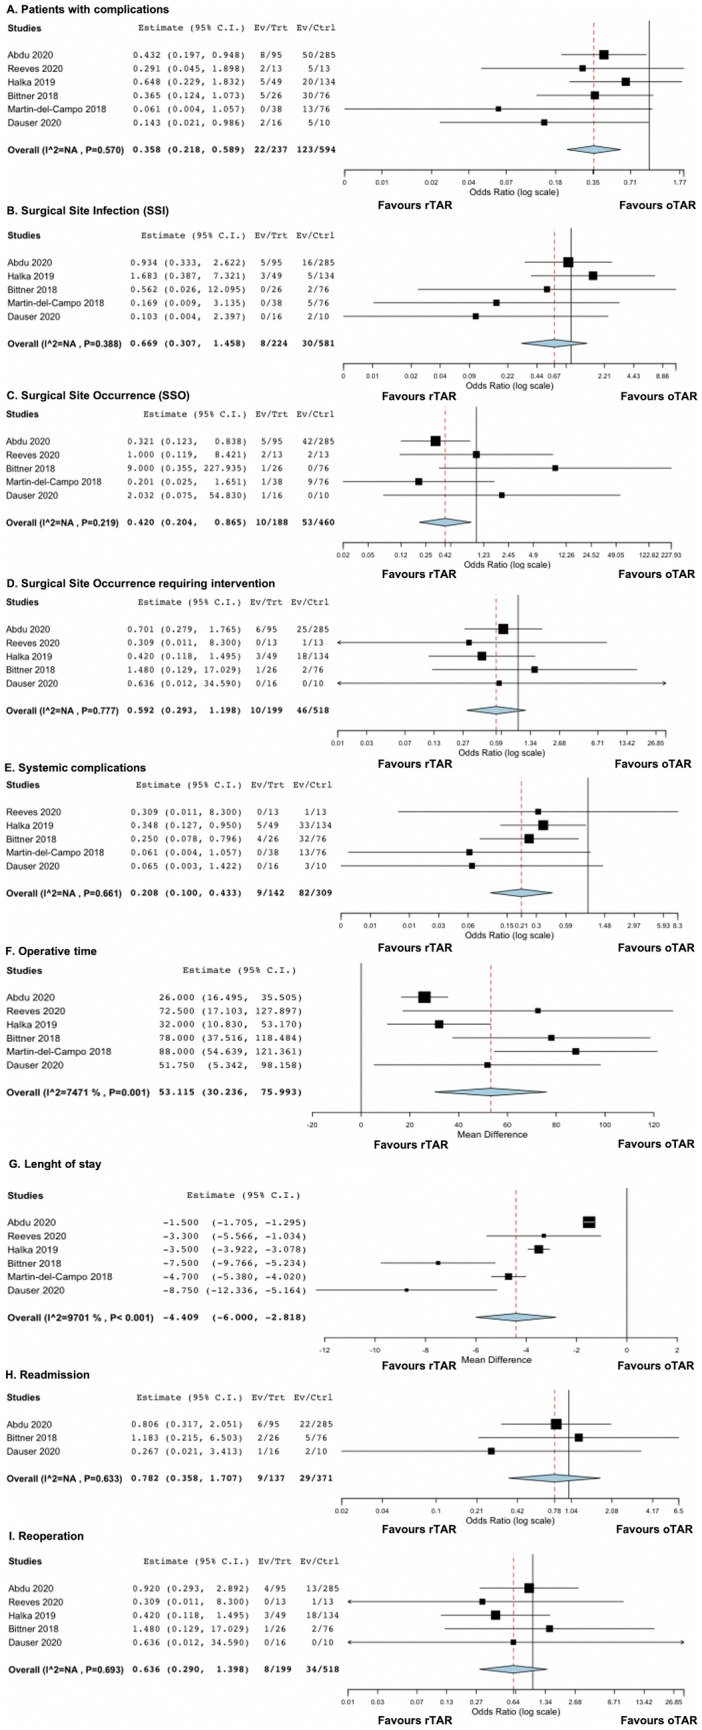
Fig. 3.

Forest plots of outcomes included in the analysis: patients with complications (A); SSI (B); SSO (C); SSO requiring intervention (D); systemic complications (E); operative time (F); length of stay (G); readmission (H); reoperation (I)

Forest plots of outcomes included in the analysis: patients with complications (A); SSI (B); SSO (C); SSO requiring intervention (D); systemic complications (E); operative time (F); length of stay (G); readmission (H); reoperation (I)