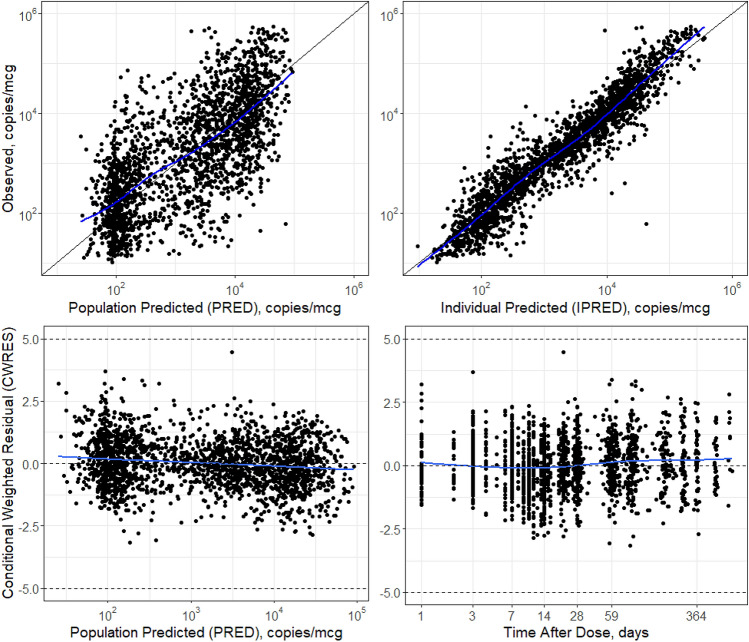
Fig. 2.
Goodness-of-fit plots of the final population cellular kinetic model of liso-cel in patients with relapsed/refractory large B-cell lymphoma. For observed versus final model PRED and IPRED liso-cel transgene levels, a line of unity is superimposed as a black solid line. An LOESS smoothing function is superimposed as a blue solid line as a guide for the eye. For final model CWRES of liso-cel transgene levels over time and PRED liso-cel transgene levels, the expected central tendency of 0 and the outlier limits of −5 and +5 are superimposed as black, dashed horizontal lines. A LOESS smoothing function is superimposed as a blue solid line as a guide for the eye. CWRES conditional weighted residuals, IPRED individual-predicted, LOESS locally weighted smoothing line, PRED population-predicted

