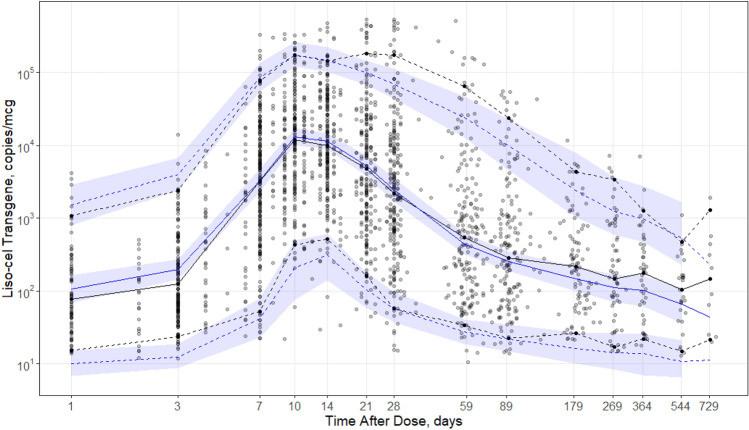
Fig. 3.
Visual predictive check of the final population cellular kinetic model of liso-cel in patients with relapsed/refractory large B-cell lymphoma. Observed data (faint points) summarized by median (black solid line) and 5th/95th percentiles (black dashed lines), binned around nominal time points. Replicate model predictions are summarized at the same percentiles (blue solid line: median; blue dashed lines: 5th/95th percentiles) as the observed data and also provide 95% prediction intervals (blue shaded area) for the 500 replicate simulations. In the case of sparse data, prediction intervals were not generated. Log transformation was applied to both axes, emphasizing the first 4 weeks after a single infusion of liso-cel

