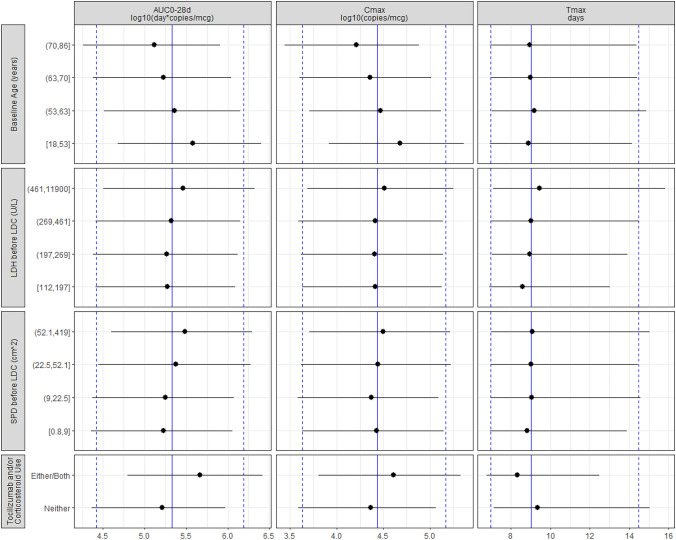
Fig. 4.
Forest plot of model covariates on simulated AUC0–28d, Cmax, and Tmax. Simulations were conditioned on the observed patient covariates (n = 261), and replicate (m = 300) simulations were conducted with between-subject variability. Blue vertical lines denote the overall simulation 50th (solid blue line) and 5th/95th (dashed blue lines) percentiles. Simulated expansion metrics were binned by covariate (quartiles of continuous covariates), and the 50th (black circle) and 5th/95th (black lines) percentiles are plotted for comparison. Tocilizumab and/or corticosteroid use refers to concomitant treatment with either/both agents or neither for the treatment of cytokine release syndrome or neurological events after liso-cel infusion. AUC0–28d area under the curve for transgene levels from 0 to 28 days post-infusion, Cmax maximum transgene levels, LDC lymphodepleting chemotherapy, LDH lactate dehydrogenase, SPD sum of the product of perpendicular diameters, Tmax time to maximum transgene levels

