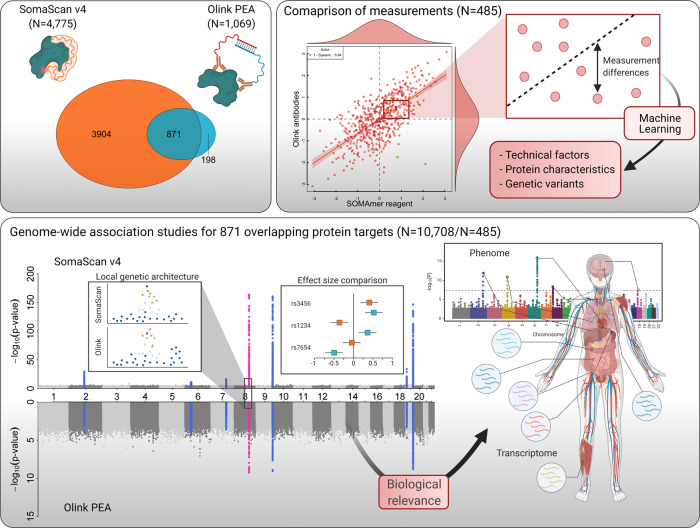
Fig. 1. Scheme of the study design.
The Venn diagram displays the overlap in protein targets captured by the SomaScan assay and the Olink proximity extension assay (PEA). Modes of binding to the protein target are depicted simplified next to each ellipse. Correlation coefficients were used to compare both technologies and factors possibly accounting for measurement differences and low correlation coefficients examined in a subset of 485 individuals with overlapping measurements. For the set of 871 common protein targets, genome-wide association analysis was performed in 10,708 (SomaScan assay) and 485 (Olink PEA) participants in the Fenland cohort. Correspondence of genetic associations was analysed by examining local genetic architecture, comparison of effect estimates and evaluation of phenotypic consequences. Parts of this figure have been created with BioRender.com.

