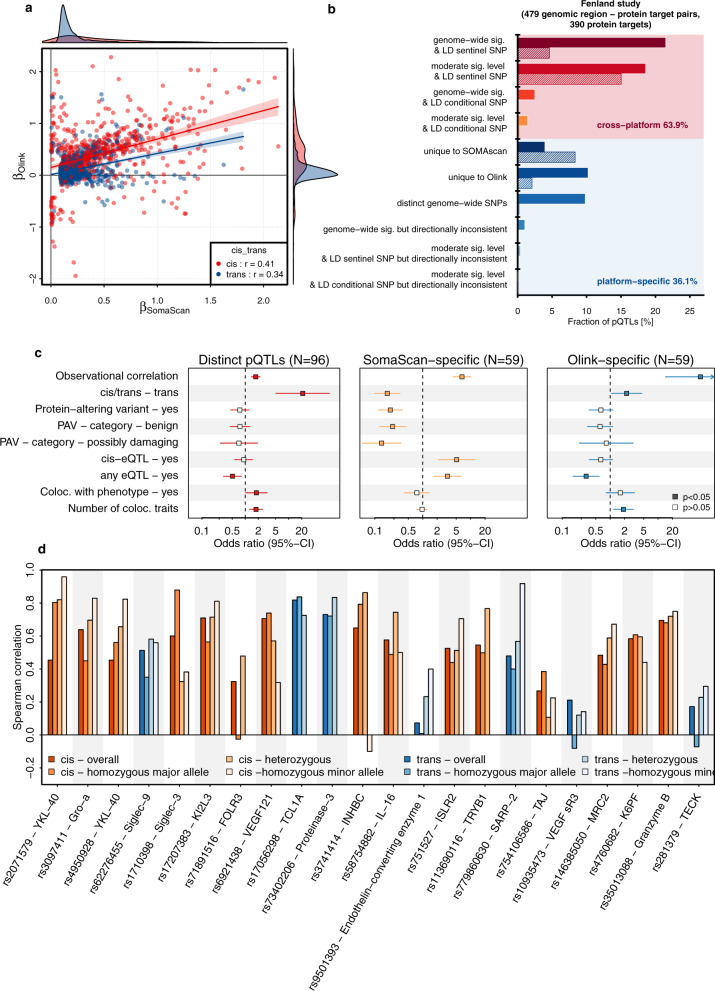
Fig. 3. Consistency of genetic effects across platforms.
a Comparison of beta estimates from linear regression models across 816 corresponding SOMAmer–Olink pairs (n = 770 unique protein targets) with at least one genome-wide associated genetic variant for either of the two, including 1267 distinct genetic variants (R2 < 0.8). Colouring is based on the genomic location of genetic variants. Red indicates variants close to the protein-encoding gene (cis, ±500 kb) and blue otherwise. Estimates are presented in Supplementary Data 3. b Summary of platform agreement for 479 genomic region–protein target associations with sufficient power among the Fenland subsample with available Olink measures (N = 485). More information is detailed in Supplementary Data 5. c Factors associated with pQTLs that are shared across platforms compared to three sets of platform-specific controls. Odds ratios and 95% confidence intervals for factors associated with cross-platform protein quantitative trait loci (pQTL) across the SomaScan v4 and Olink assays (Supplementary Data 9). The panels are based on 540 variant–protein target pairs (306 shared, 234 platform-specific) with sufficient power for replication in the Fenland sample. PAV protein altering variant, eQTL expression quantitative trait loci, Coloc. colocalisation, GWAS genome-wide association analysis. d Spearman correlation coefficients stratified by genotype. The first bar in each column indicates the overall correlation, and the three successive bars indicate the correlation among homozygous carriers of the major allele, heterozygous carriers and homozygous carriers of the minor allele (if any). Colours indicate whether the pQTL was in cis (orange) or trans (blue). Protein target–pQTL pairs were selected based on a linear regression model (see main text). Source data are provided as a Source Data file.

